
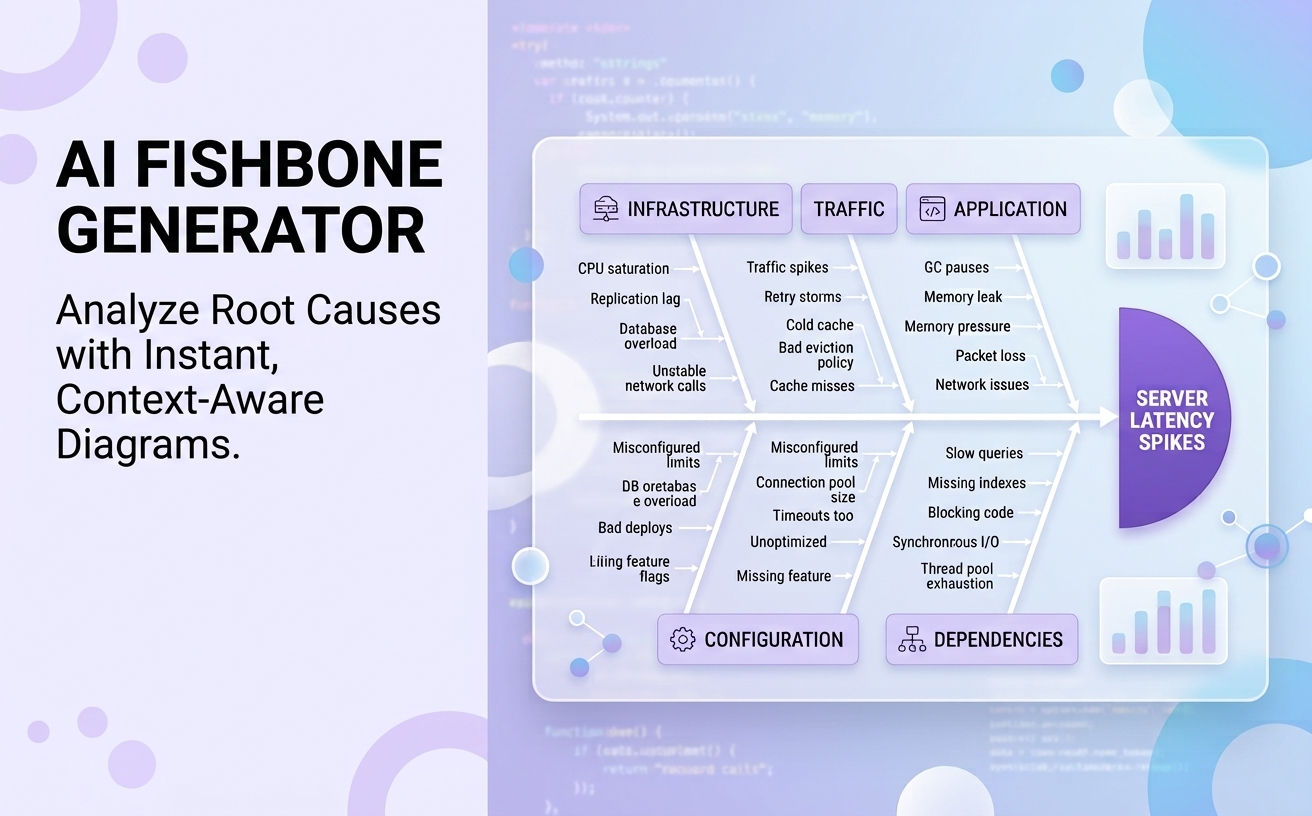
Root cause analysis is one of the most vital steps in modern problem-solving, software engineering, and quality management. However, manually mapping out complex cause-and-effect relationships during high-pressure troubleshooting sessions often consumes valuable time. Visual Paradigm is thrilled to announce a major enhancement to our AI Diagramming Chatbot: full native support for generating Ishikawa Diagrams (Fishbone Diagrams) through simple natural language prompts.
Whether you need an AI Fishbone Diagram generator to diagnose server performance degradation, pinpoint manufacturing defects, or streamline business workflows, our chatbot instantly converts complex operational problems into structured, highly readable Mermaid-based diagrams accompanied by automated technical explanations.
Why the Ishikawa Diagram Enhancement Matters
When incidents occur—such as unexpected server latency spikes, deployment failures, or supply chain bottlenecks—teams need to transition from frantic firefighting to structured investigation immediately. Traditional diagramming requires manually drawing bones, creating text boxes, and aligning branches while trying to hold a brain-storming session.
With our updated AI Fishbone Diagram tool, you eliminate manual visual formatting entirely. By simply describing the problem statement to the AI chatbot, you receive an industry-standard, syntactically precise Ishikawa diagram instantly. This allows engineering, quality assurance, and product teams to jump straight into structured problem-solving without getting bogged down in graphic layout mechanics.
How It Works: Conversational Cause & Effect Modeling
Generating a detailed cause-and-effect structure is as easy as typing a prompt into the chat window. For instance, when investigating web service bottlenecks, you can issue a prompt such as:
“Generate an Ishikawa Diagram for investigating the causes behind server latency spikes in a high-traffic web service.”
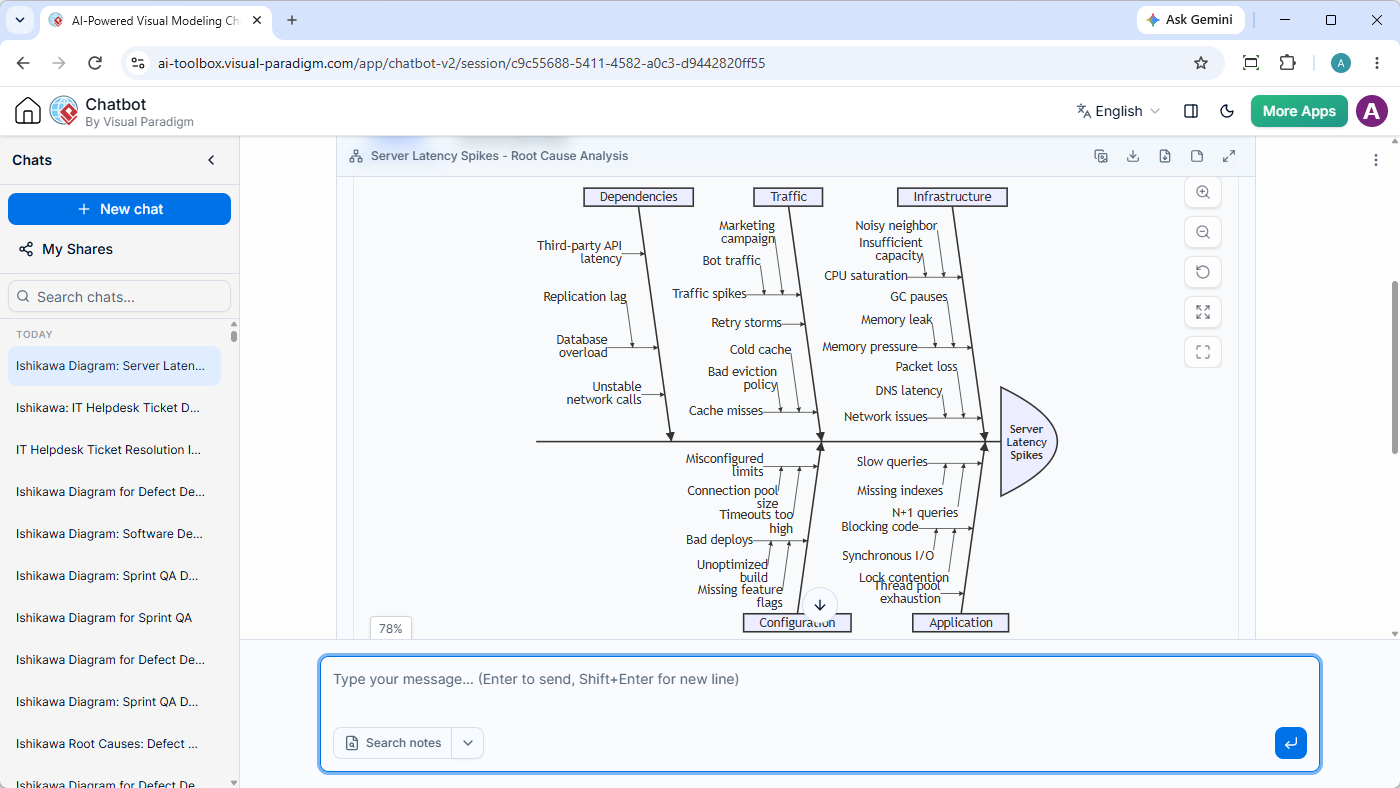
The AI Fishbone Diagram generator processes the context and returns a complete, syntax-accurate Mermaid script rendered as a clean, interactive diagram within the chat viewport, complete with primary categories (such as Infrastructure, Application, Traffic, Configuration, and Dependencies) and granular sub-causes.
Example Output Generated by the Chatbot
Below is an example of the Mermaid-based script automatically produced by the chatbot during a latency analysis prompt:
---
title: Server Latency Spikes - Root Cause Analysis
vpDiagramType: IshikawaDiagram
---
ishikawa-beta
    Server Latency Spikes
    Infrastructure
        CPU saturation
            Noisy neighbor
            Insufficient capacity
        Memory pressure
            GC pauses
            Memory leak
        Network issues
            Packet loss
            DNS latency
    Application
        Slow queries
            Missing indexes
            N+1 queries
        Blocking code
            Synchronous I/O
            Lock contention
        Thread pool exhaustion
    Traffic
        Traffic spikes
            Marketing campaign
            Bot traffic
        Retry storms
        Cache misses
            Cold cache
            Bad eviction policy
    Configuration
        Misconfigured limits
            Connection pool size
            Timeouts too high
        Bad deploys
            Unoptimized build
            Missing feature flags
    Dependencies
        Third-party API latency
        Database overload
            Replication lag
        Unstable network calls
You can view the live interactive session of this exact example here to see how the diagram, explanation, and interactive tools function together seamlessly.
Key Benefits of Visual Paradigm’s AI Fishbone Diagram Tool
- Instant Structure out of Chaos: Instantly translate raw incident notes or verbal brainstorms into standardized cause-and-effect structures using our advanced Fishbone Diagram AI logic.
- Automated Explanations & Next Steps: The chatbot does not stop at generating the visual model; it provides structured, context-aware instructions explaining how to systematically investigate each branch (e.g., prioritizing infrastructure resource checks before diving into deep application profiling).
- High Precision, Syntax-Accurate Mermaid Code: Built on domain-trained AI models, our chatbot generates syntactically correct code, avoiding the rendering errors common in generic text-based LLMs.
- Flexible Export Options: Export your generated Ishikawa diagrams in vector SVG or high-resolution PNG formats, copy direct visual outputs to your clipboard, or export full chat transcripts to Markdown or PDF.
Unlocks Full Value Across the Visual Paradigm Ecosystem
While standalone chat tools isolate your output in a browser tab, Visual Paradigm’s AI Fishbone Diagram generator integrates natively across our entire software suite, turning rapid AI ideation into an actionable part of your enterprise workflow:
- Precision Editing via VPasCode: Need to customize your diagram’s code directly? Instantly bridge your script into VPasCode for precise code-level fine-tuning and version-controlled diagram management.
- Rich Documentation with OpenDocs: Send your generated Ishikawa diagrams straight to the pipeline and embed them directly into technical specifications, incident post-mortems, or SLA reports inside Visual Paradigm OpenDocs.
- Knowledge Retention with NotesKeep: Save chatbot responses, specific investigation steps, or generated fishbone diagrams directly into NotesKeep with a single click. Later, you can query the AI chatbot using your stored NotesKeep knowledge base as ground truth for future incident reviews.
- Visual Polish in VP Online & VP Desktop: Transition from AI text-to-diagram generation into Visual Paradigm Online’s drag-and-drop graphic editor, or sync directly into Visual Paradigm Desktop projects for enterprise architectural governance.
Start Generating AI Fishbone Diagrams Today
Stop spending hours manually layout-formatting root cause models during critical team meetings. Leverage the power of the ultimate AI Fishbone Diagram tool to accelerate incident management, quality control, and strategic problem-solving.
Experience conversational diagramming firsthand and transform how your team performs root cause analysis today!
Try the AI Diagramming Chatbot Now
Related posts:
 Visual Paradigm AI Chatbot Now Supports Multiple Languages: UI and Conversation Enhancements
 Introducing Enhanced Data Flow Diagram (DFD) Generation with Intelligent Layouts
 Visual Paradigm AI Diagramming Chatbot Introduces Instant AI ERD Generator
 AI UML: Generate PlantUML Profile Diagram with AI Diagramming Chatbot