


We are thrilled to announce a major update to VPasCode: full support for the D2 diagram-as-code language! With this update, architects, developers, and technical writers can instantly transform declarative D2 text scripts into clean, professional visual diagrams with zero friction.
Whether you are mapping out complex cloud architecture, microservices topology, or organizational workflows, VPasCode functions as your go-to free D2 editor and feature-rich online D2 tool. Experience seamless, real-time visualization right inside your browser.
To learn more about our platform capabilities and updates, visit the official VPasCode Page.
How the D2 Integration Works in VPasCode
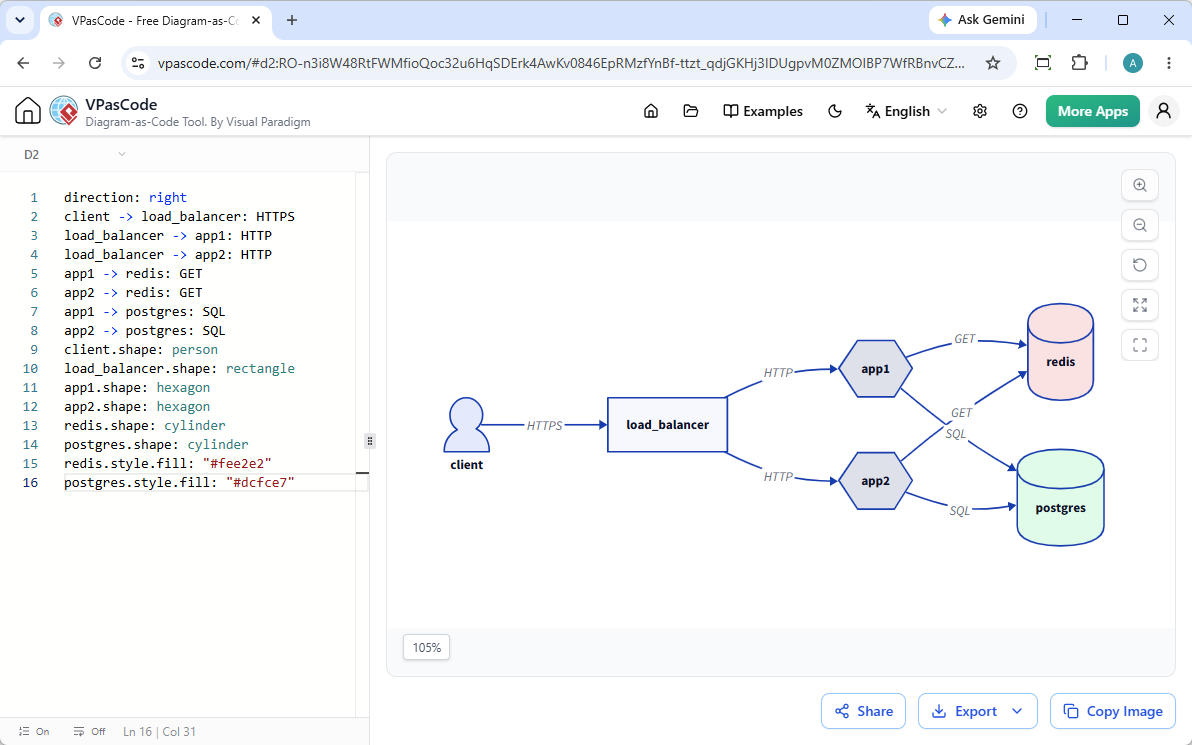
Using D2 in VPasCode is fast, intuitive, and designed to maximize your productivity. The workspace features a convenient side-by-side layout:
- Left Pane (Code Editor): Simply paste, type, or edit your D2 script. VPasCode’s automatic format detection immediately recognizes your code without requiring manual language toggles.
- Right Pane (Live Visualizer): Watch your diagram render dynamically in real-time as you type or modify code blocks.
The video below shows you how to create a D2 diagram in Visual Paradigm VPasCode diagram-as-code editor.
Ready to try it out yourself? Jump straight into action with our VPasCode Editor.
Key Features Included with D2 Support
Beyond live rendering, our new D2 integration comes packed with versatile collaboration and output options to fit your workflow:
- Flexible Export Options: Download your finished diagrams instantly as scalable SVG vector graphics or high-resolution PNG images for reports, presentations, and documentation.
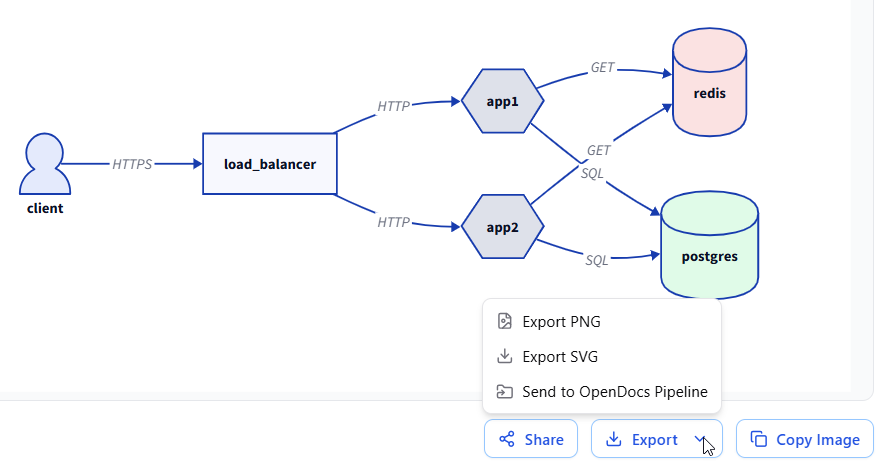
- Clipboard Integration: Quickly copy your rendered diagram image straight to your clipboard with a single click to paste directly into Slack, emails, or word processors.
- Instant URL Sharing: Share your work effortlessly with colleagues or clients via direct hyperlinks. Best of all, no login is required for viewers to inspect your shared diagrams.
Demonstration: Building a Basic Network Diagram in D2
To see how effortless it is to model systems using this free D2 editor, consider the following example of a basic multi-tier network architecture.
D2 Source Code
direction: right
client -> load_balancer: HTTPS
load_balancer -> app1: HTTP
load_balancer -> app2: HTTP
app1 -> redis: GET
app2 -> redis: GET
app1 -> postgres: SQL
app2 -> postgres: SQL
client.shape: person
load_balancer.shape: rectangle
app1.shape: hexagon
app2.shape: hexagon
redis.shape: cylinder
postgres.shape: cylinder
redis.style.fill: "#fee2e2"
postgres.style.fill: "#dcfce7"How This Renders in Our Online D2 Tool
When you paste the script above into VPasCode, the engine processes the relationships, directionality, and custom shape styling automatically:
- The client is styled as a distinct person icon initiating HTTPS requests to a rectangular load_balancer.
- Traffic splits cleanly across two hexagonal application nodes (app1 and app2).
- Both application nodes securely query backend caching layers (redis, styled in a soft red hue) and relational data stores (postgres, styled in a soft green hue).
More D2 Diagram Examples
Basic Shapes
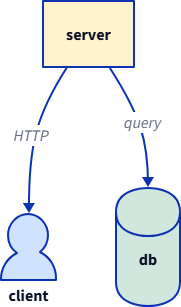
server -> client: HTTP
server -> db: query
client: {
  shape: person
  style.fill: "#cfe2ff"
}
db: {
  shape: cylinder
  style.fill: "#d1e7dd"
}
server.style.fill: "#fff3cd"
Containers
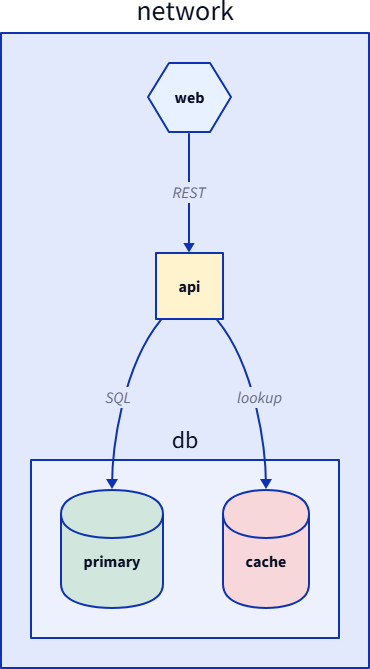
network: {
  web: {
    shape: hexagon
    style.fill: "#e7f1ff"
  }
  api: {
    shape: rectangle
    style.fill: "#fff3cd"
  }
  db.primary: {
    shape: cylinder
    style.fill: "#d1e7dd"
  }
  db.cache: {
    shape: cylinder
    style.fill: "#f8d7da"
  }
  web -> api: REST
  api -> db.primary: SQL
  api -> db.cache: lookup
}Styled
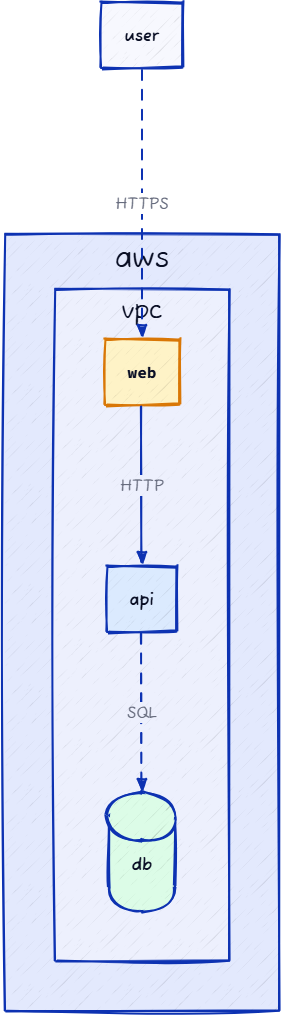
vars: {
  d2-config: {
    sketch: true
    layout-engine: elk
  }
}
aws: {
  vpc: {
    web: {
      shape: rectangle
      style: {
        fill: "#fef3c7"
        stroke: "#d97706"
        stroke-width: 2
        font: mono
      }
    }
    api: {
      shape: rectangle
      style.fill: "#dbeafe"
    }
    db: {
      shape: cylinder
      style.fill: "#dcfce7"
    }
  }
}
user -> aws.vpc.web: HTTPS {
  style.animated: true
}
aws.vpc.web -> aws.vpc.api: HTTP
aws.vpc.api -> aws.vpc.db: SQL {
  style.stroke-dash: 5
}Sequence
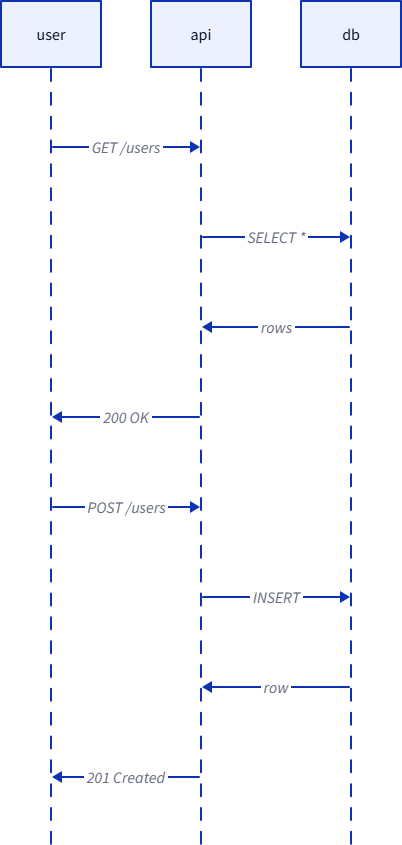
shape: sequence_diagram
user -> api: GET /users
api -> db: SELECT *
db -> api: rows
api -> user: 200 OK
user -> api: POST /users
api -> db: INSERT
db -> api: row
api -> user: 201 CreatedNotes: You may want to create Sequence Diagram with PlantUML. Check out how to do this at:
What is VPasCode?
If you are new to our platform, Visual Paradigm VPasCode is a unified, browser-based diagram-as-code solution built for modern technical teams. It eliminates the hassle of manual drag-and-drop drawing tools by letting you define architecture and data models entirely through code.
In addition to D2, VPasCode supports a vast array of popular diagramming formats and structured languages, including PlantUML, Mermaid, Graphviz, ECharts, SQL, YAML, JSON, and major programming languages like Java, Python, Rust, and TypeScript. Core code editing, live previewing, and image exporting are completely free.
Start Creating Today
Enhance your technical documentation and architectural modeling today. Experience the speed and convenience of our new D2 capabilities by launching the application right now at the VPasCode Editor.
Related posts:
 AI Chart Generation: Create with Chatbot, Edit with VPasCode
 Visualize Configuration in Seconds: VPasCode Adds Support for TOML
 Visualize Scala Source Code as UML Class Diagrams with VPasCode
 Seamless Transition from Ideation to Modeling: Export VPasCode Diagrams to Visual Paradigm Desktop via Pipeline