


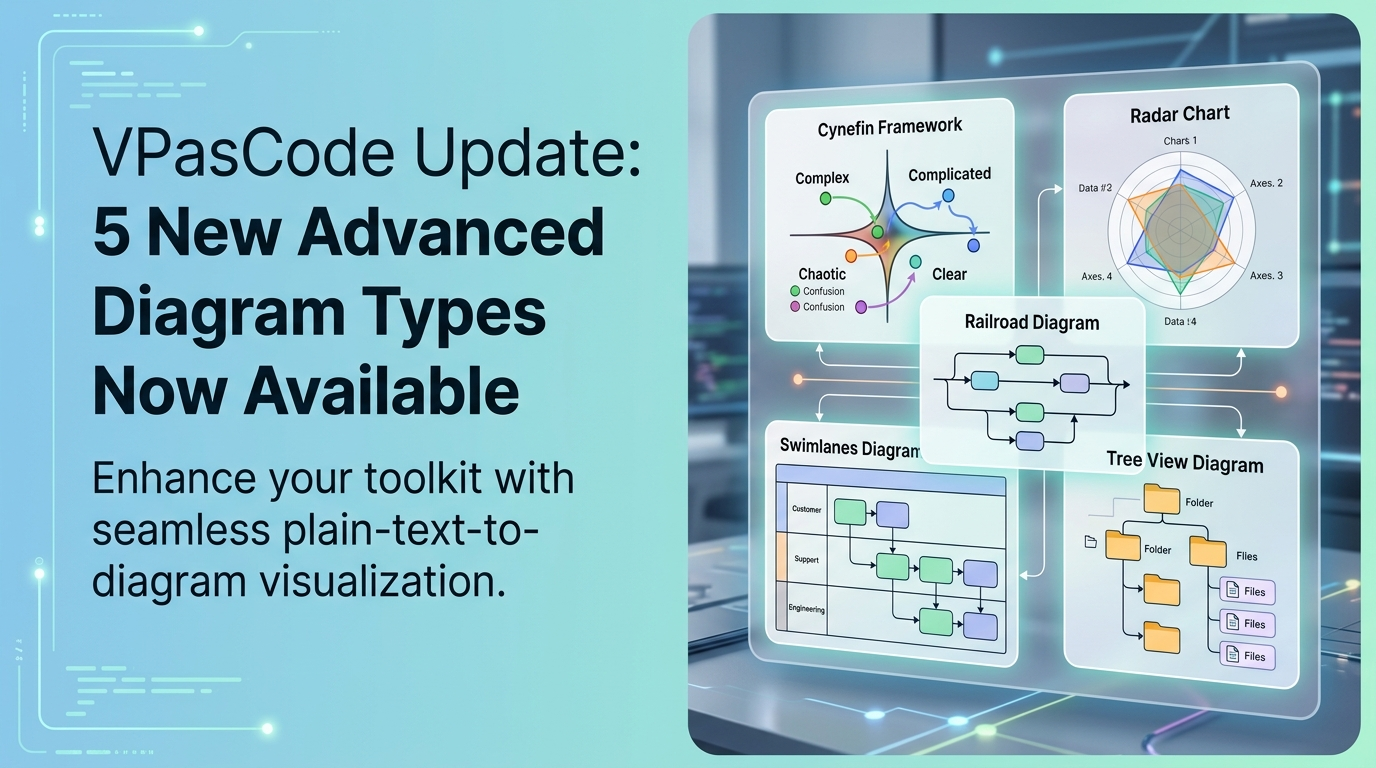
🚀 Visual Paradigm is thrilled to roll out our latest feature update for Visual Paradigm VPasCode, our all-in-one text-to-diagram workspace. We are broadening your diagramming toolkit with full support for five new highly-requested visualization types—all built effortlessly from plain text.
- 🧠 Cynefin Framework – Deconstruct complex challenges and pinpoint the right strategic response.
- 🎯 Radar Chart – Plot and compare performance metrics or feature sets across multiple dimensions simultaneously.
- 🚂 Railroad Diagram – Illustrate code syntax rules and language grammar with clean, linear pathways.
- 🏊 Swimlanes Diagram – Map operational workflows to show exactly which department or system owns each task.
- 🌳 Tree View Diagram – Outline file directories, site architectures, or nested item breakdowns in a crisp layout.
Whether you are mapping software architecture, managing project workflows, or defining business strategy, VPasCode removes the friction. Type your ideas in plain text, watch them render instantly, and share or export your diagrams in SVG or PNG format with a single click.
🔍 Why Teams Choose VPasCode
VPasCode bridges the gap between different technical diagramming standards. Our environment seamlessly interprets PlantUML, Mermaid, Graphviz, and more within a single interface. There is no software to install and no learning curve for multiple proprietary tools—just open your browser and build.
This update expands our code-to-diagram library. Check out the functional examples below to see how easy it is to start using these new formats right now.
📌 1. Cynefin Framework – Strategic Decision Making
The Cynefin framework is an essential tool for leadership and operational teams to categorize situations. By sorting problems into specific domains, it guides you on whether to deploy standard procedures or experiment with creative solutions.
✅ Example – Project Risk Analysis
cynefin-beta
    title Project Risk Evaluation

    complex
        "Adaptive Planning"
        "New Feature Discovery"

    complicated
        "Engineering Analysis"

    clear
        "Standard Operations"

    chaotic
        "Crisis Response"

    confusion
        "Unassessed Tasks"

    complex --> complicated : "Pattern identified"
    clear --> chaotic : "Complacency"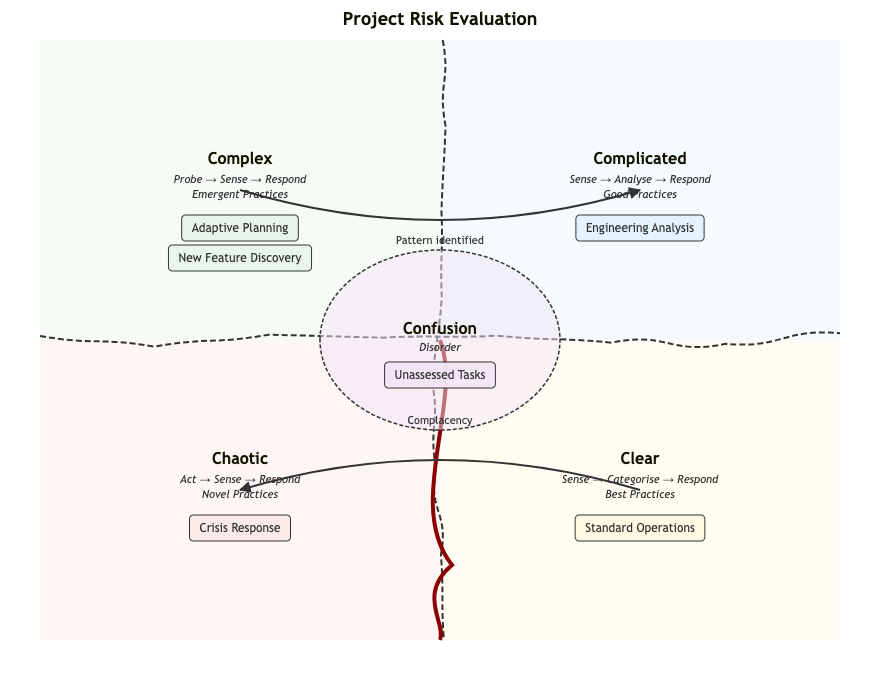
💡 Quick Tip: Use the cynefin identifier, add a title, and map your text labels directly into the five specialized quadrants.
📌 2. Radar Chart – Multi-Dimensional Metrics
Commonly called a spider chart, a Radar diagram is the best way to score and compare items across distinct categories. It is highly effective for evaluating product features, vendor capabilities, or team competencies side-by-side.
✅ Example – Student Performance Overview
---
title: "Grades"
---
radar-beta
  axis m["Math"], s["Science"], e["English"]
  axis h["History"], g["Geography"], a["Art"]
  curve a["Alice"]{85, 90, 80, 70, 75, 90}
  curve b["Bob"]{70, 75, 85, 80, 90, 85}

  max 100
  min 0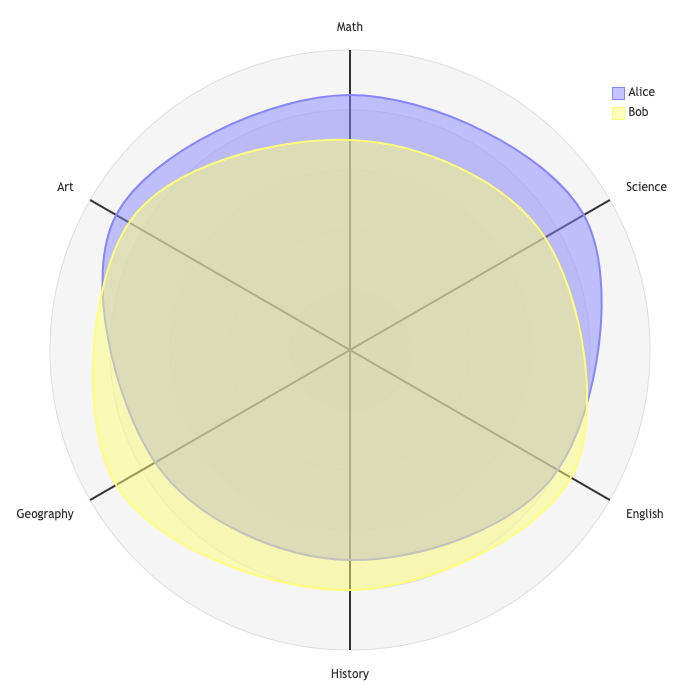
💡 Quick Tip: Define your comparison points inside the axis bracket, then use a dataset row for each entity to map out their scores.
📌 3. Railroad Diagram – Structural Coding Rules
Railroad charts visually break down syntax grammar. They serve as excellent documentation for developers, illustrating the valid paths a parser or compiler can take to read a specific snippet of code.
✅ Example – Web Address Syntax Verification
railroad-ebnf-beta
    title "HTTP URL Protocol Rule"

    protocol = "http" | "https" ;
    separator = "://" ;
    url = protocol , separator , hostname ;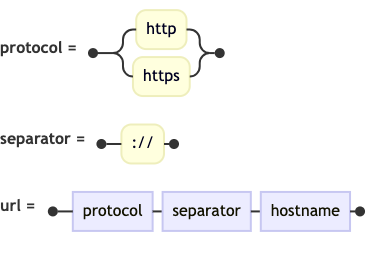
💡 Quick Tip: Build out paths by arranging structural tokens like start, terminal strings, and optional blocks to show code pathways.
📌 4. Swimlanes Diagram – Workflow Ownership
Swimlanes bring absolute clarity to complex business processes. By dividing workflows into horizontal rows, everyone on the team can instantly see where cross-functional handoffs happen and who is responsible for each milestone.
✅ Example – Customer Support Escalation
swimlane-beta LR
    subgraph Customer
        request[Open Request]
    end
    subgraph Support
        triage[Triage]
    end
    subgraph Engineering
        resolve[Resolve]
    end

    request --> triage
    triage --> resolve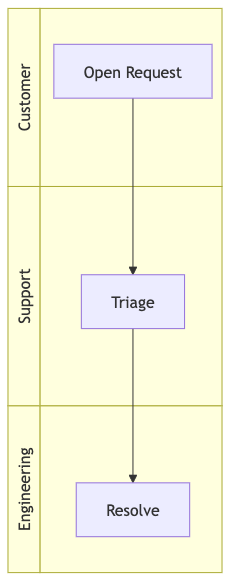
💡 Quick Tip: Set up distinct lane headers for each team or process layer, then map tasks and trigger steps using standard arrows (->).
📌 5. Tree View Diagram – Nested Structures
When you need to display hierarchical relations without drawing massive flowchart webs, Tree View is the perfect format. It provides a clean, indented breakdown of file directories, site structures, or bill of materials.
✅ Example – Documentation Site Architecture
treeView-beta
my-project/
    src/
        index.js
        styles.css
    "public folder"/
        favicon.ico
    package.json
    README.md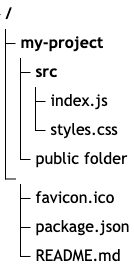
💡 Quick Tip: Nest your items logically using root, dir, and file parameters combined with clean indentation to auto-generate a structured tree layout.
🛠️ Launch the VPasCode Editor
Ready to try them out? Head over to the live workspace: https://www.vpascode.com/.
Toggle your diagram language mode, paste any of the code examples provided above, and watch your markdown text transform into a production-ready diagram instantly.