
🚀 Visual Paradigm is excited to announce that VPasCode – our unified diagram-as-code platform – now supports four additional Mermaid diagram types. You can now create the following professional diagrams using simple text notation:
- 🐟 Ishikawa (Fishbone / Cause-and-Effect) Diagram – Root cause analysis made easy
- ⚡ Event Modeling Diagram – Design system information flow and timelines
- 🟡 Venn Diagram – Visualize set relationships and intersections
- 🗺️ Wardley Maps – Strategic value chain mapping and evolution analysis
Whether you are a product manager, software architect, developer, or strategist, VPasCode helps you create diagrams using the syntax you already know, with real-time preview, one-click URL sharing, and free SVG/PNG export.
🔍 What Makes VPasCode Different?
VPasCode (short for Visual Paradigm’s asCode platform) is a unified text-to-diagram environment. It renders PlantUML, Mermaid, Graphviz, and more (with additional formats coming). You can freely switch between syntaxes within the same editor, without learning multiple tools.
This enhancement focuses on Mermaid’s latest syntax (v11.12.3+ and v11.15.0+). Below you will find working code examples for each new diagram type – just copy and paste them into VPasCode.
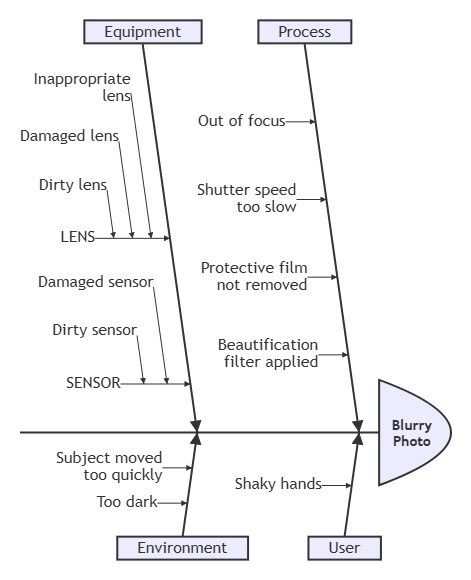
📌 1. Ishikawa (Fishbone) Diagram – Root Cause Analysis
Also known as cause-and-effect or fishbone diagram. Perfect for quality management and problem-solving sessions.
✅ Example – “Blurry Photo” Root Cause Analysis
ishikawa-beta
    Blurry Photo
    Process
        Out of focus
        Shutter speed too slow
        Protective film not removed
        Beautification filter applied
    User
        Shaky hands
    Equipment
        LENS
            Inappropriate lens
            Damaged lens
            Dirty lens
        SENSOR
            Damaged sensor
            Dirty sensor
    Environment
        Subject moved too quickly
        Too dark
💡 Syntax notes: The first line defines the problem (the fish “head”). Indentation creates the hierarchical cause branches (fishbones).
📌 2. Event Modeling Diagram – System Behavior over Time
Event Modeling describes how information changes within a system over time. It uses UI, commands, events, and processors organized in swimlanes. VPasCode supports both compact and relaxed syntax, inline data, and external data blocks.
✅ Minimal Example – Shopping Cart Add Item Flow
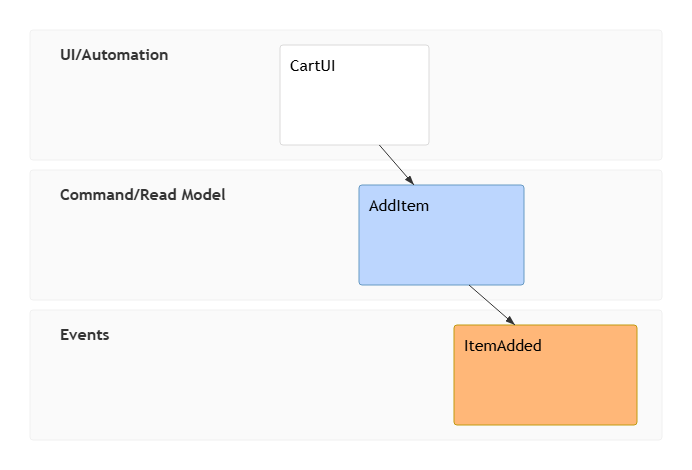
eventmodeling

tf 01 ui CartUI
tf 02 cmd AddItem
tf 03 evt ItemAdded
✅ Inline Data Example
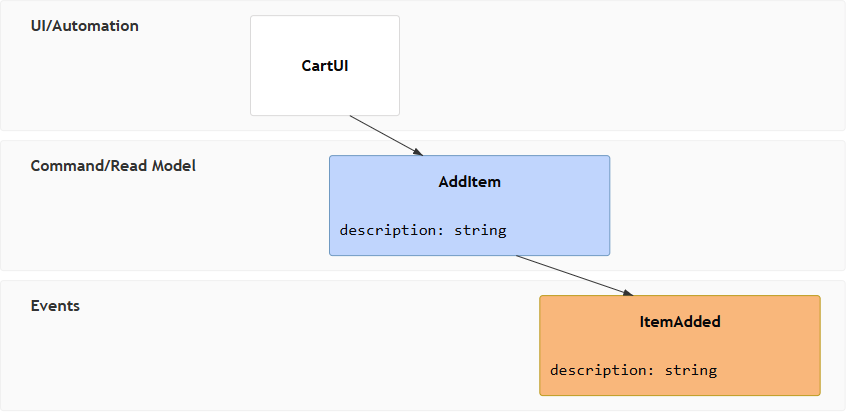
eventmodeling

tf 01 ui CartUI
tf 02 cmd AddItem { description: string }
tf 03 evt ItemAdded { description: string }
✅ Data Blocks & Multiple References
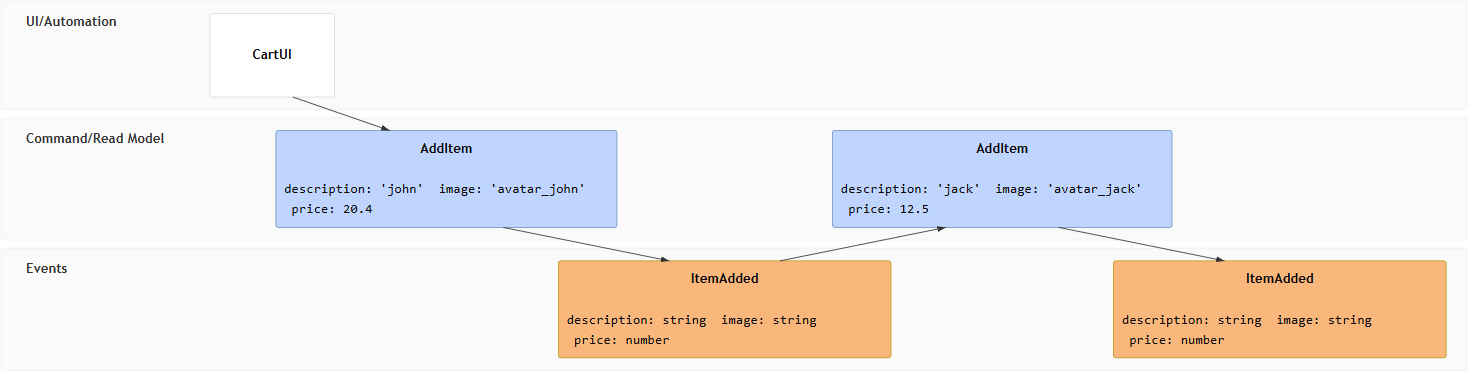
eventmodeling

tf 01 ui CartUI
tf 02 cmd AddItem [[AddItem01]]
tf 03 evt ItemAdded [[ItemAdded]]
tf 04 cmd AddItem [[AddItem02]]
tf 05 evt ItemAdded [[ItemAdded]]

data AddItem01 {
  description: 'john'
  image: 'avatar_john'
  price: 20.4
}

data AddItem02 {
  description: 'jack'
  image: 'avatar_jack'
  price: 12.5
}

data ItemAdded {
  description: string
  image: string
  price: number
}
✅ Reset Frame
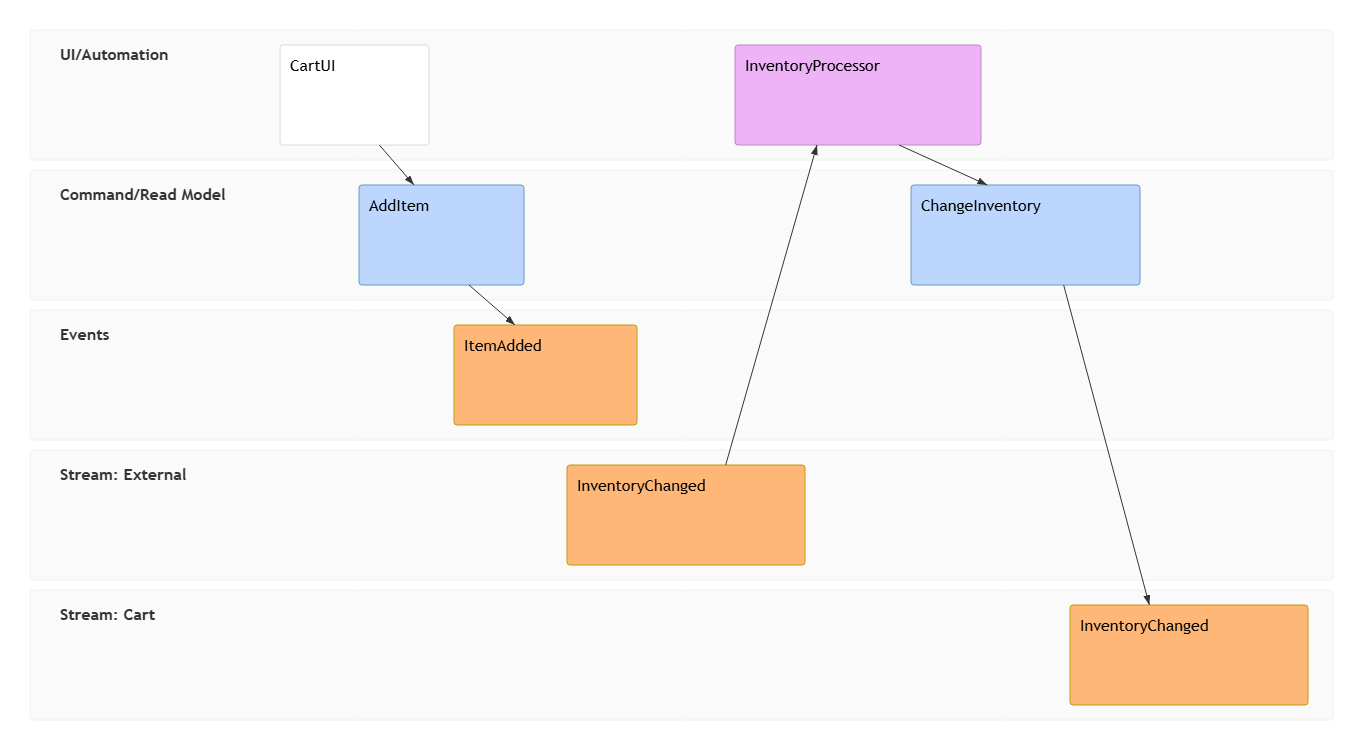
eventmodeling

tf 01 ui CartUI
tf 02 cmd AddItem
tf 03 evt ItemAdded

rf 04 evt External.InventoryChanged
tf 05 pcr InventoryProcessor
tf 06 cmd ChangeInventory
tf 07 evt Cart.InventoryChanged
💡 Key tokens: tf (timeframe), rf (resetframe), ui / cmd / evt / pcr / rmo (entity types). Use namespaces like Inventory.InventoryChanged to create separate swimlanes.
📌 3. Venn Diagram – Set Relationships & Intersections
Show logical relationships between sets using overlapping circles. Supports custom sizes, labels, text nodes, and styling.
✅ Basic Example – Team Overlap
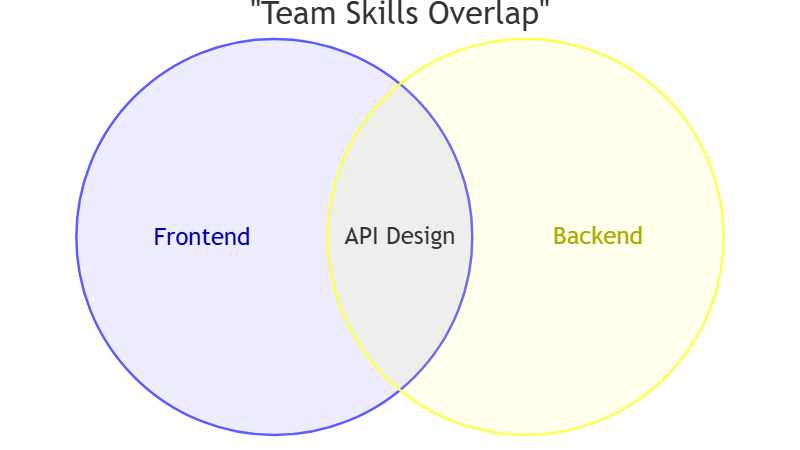
venn-beta
  title "Team Skills Overlap"
  set Frontend
  set Backend
  union Frontend,Backend["API Design"]
✅ Sizes, Text Nodes & Styling Example
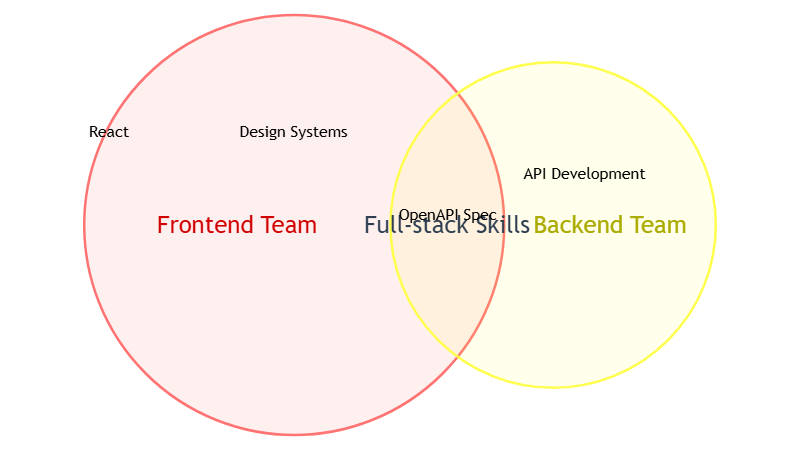
venn-beta
  set A["Frontend Team"]:20
    text A1["React"]
    text A2["Design Systems"]
  set B["Backend Team"]:12
    text B1["API Development"]
  union A,B["Full-stack Skills"]:3
    text AB1["OpenAPI Spec"]
  style A fill:#ff6b6b
  style A,B color:#2c3e50
  style A1 color:#e74c3c
💡 Use :number to control circle size, text to add labels inside sets, and style for custom colors.
📌 4. Wardley Maps – Strategic Value Chain Mapping
Wardley Maps help you visualize the components of a business or system, their position in the value chain, and their evolutionary stage (Genesis → Custom Built → Product → Commodity). VPasCode fully supports the official Mermaid Wardley syntax using wardley-beta as the diagram type.
✅ Example – Software Development Pipeline
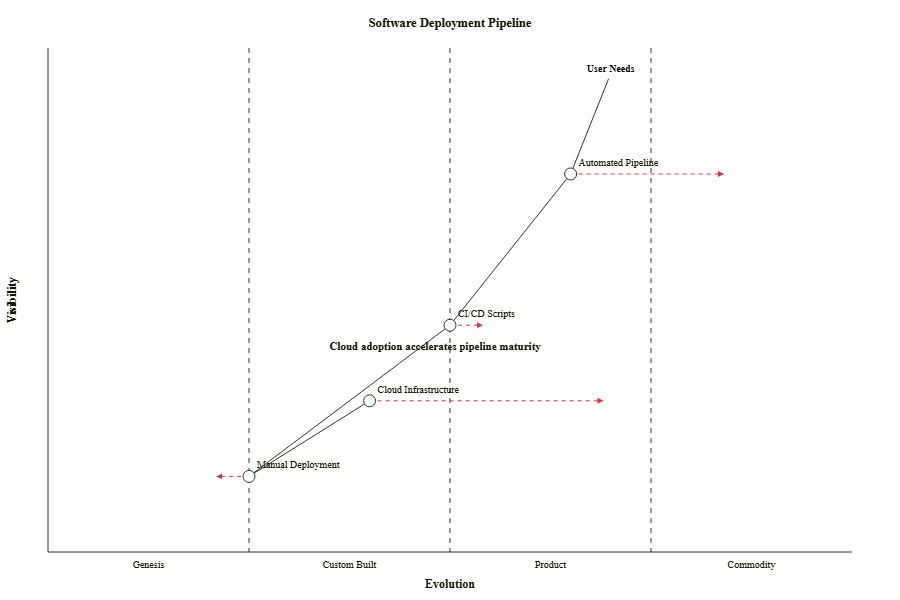
wardley-beta
title Software Deployment Pipeline

anchor "User Needs" [0.95, 0.70]
component "Manual Deployment" [0.15, 0.25]
component "CI/CD Scripts" [0.45, 0.50]
component "Automated Pipeline" [0.75, 0.65]
component "Cloud Infrastructure" [0.30, 0.40]

"User Needs" -> "Automated Pipeline"
"Automated Pipeline" -> "CI/CD Scripts"
"CI/CD Scripts" -> "Manual Deployment"
"Manual Deployment" -> "Cloud Infrastructure"

evolve "Manual Deployment" 0.20
evolve "CI/CD Scripts" 0.55
evolve "Automated Pipeline" 0.85
evolve "Cloud Infrastructure" 0.70

note "Cloud adoption accelerates pipeline maturity" [0.40, 0.35]
💡 Component names with spaces must be wrapped in double quotes. Coordinates range from 0 to 1 on both axes (visibility vs. evolution).
🛠️ Try VPasCode Right Now
Go to the VPasCode editor: https://www.vpascode.com/.
Select the Mermaid syntax mode, paste any of the code examples above, and watch your diagram render instantly.
Start for free – No credit card required, no installation. All you need is a browser.
📖 Official Documentation & References
Visual Paradigm – Professional Modeling, Simplified.
VPasCode is the diagram-as-code platform for teams who value efficiency, collaboration, and text-based diagramming.