
When critical incidents occur—such as server latency spikes or build pipeline failures—teams need to transition from frantic firefighting to structured root cause analysis immediately. However, manually drawing bones and aligning text branches during a high-pressure incident review wastes precious time.
VPasCode now brings AI-driven Ishikawa (Fishbone) Diagrams directly into your diagram-as-code workflow.
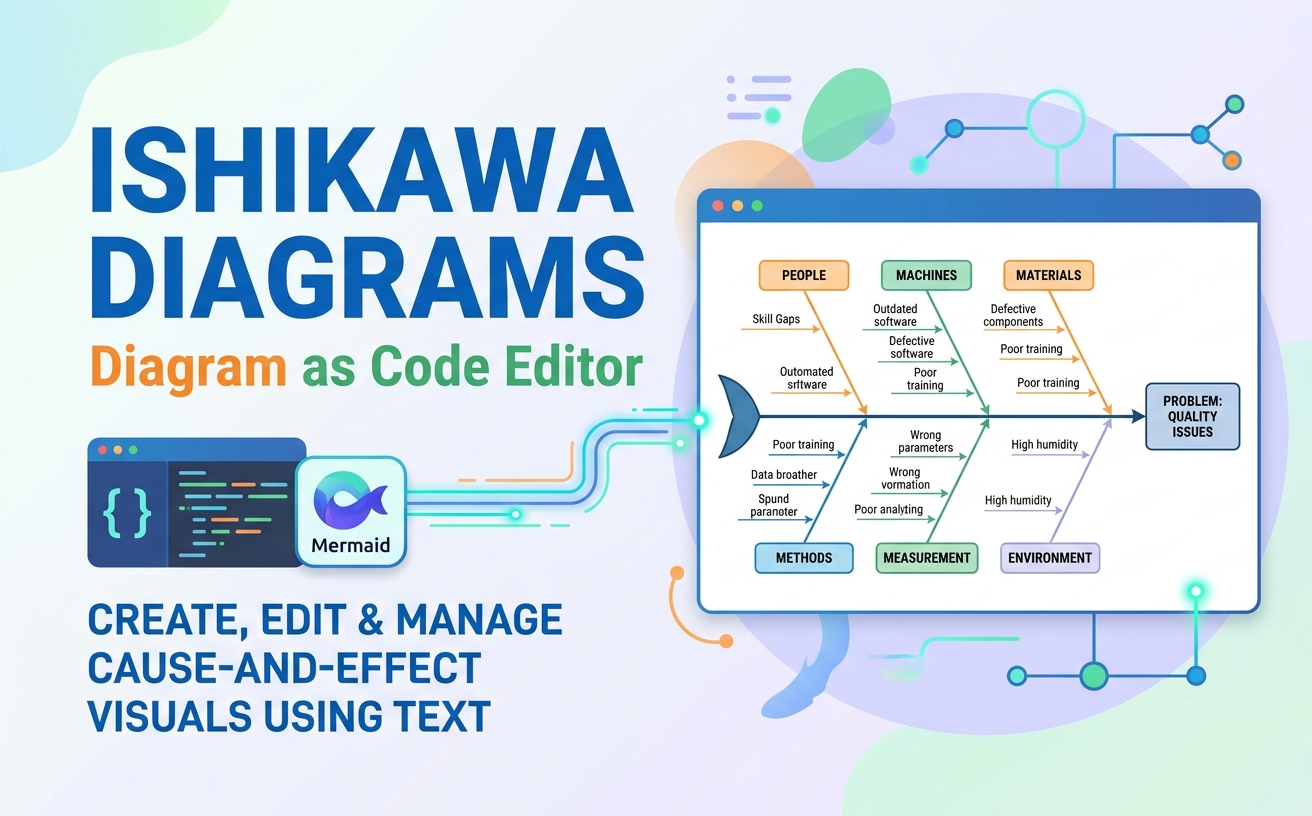
Shift from Manual Formatting to AI Generation
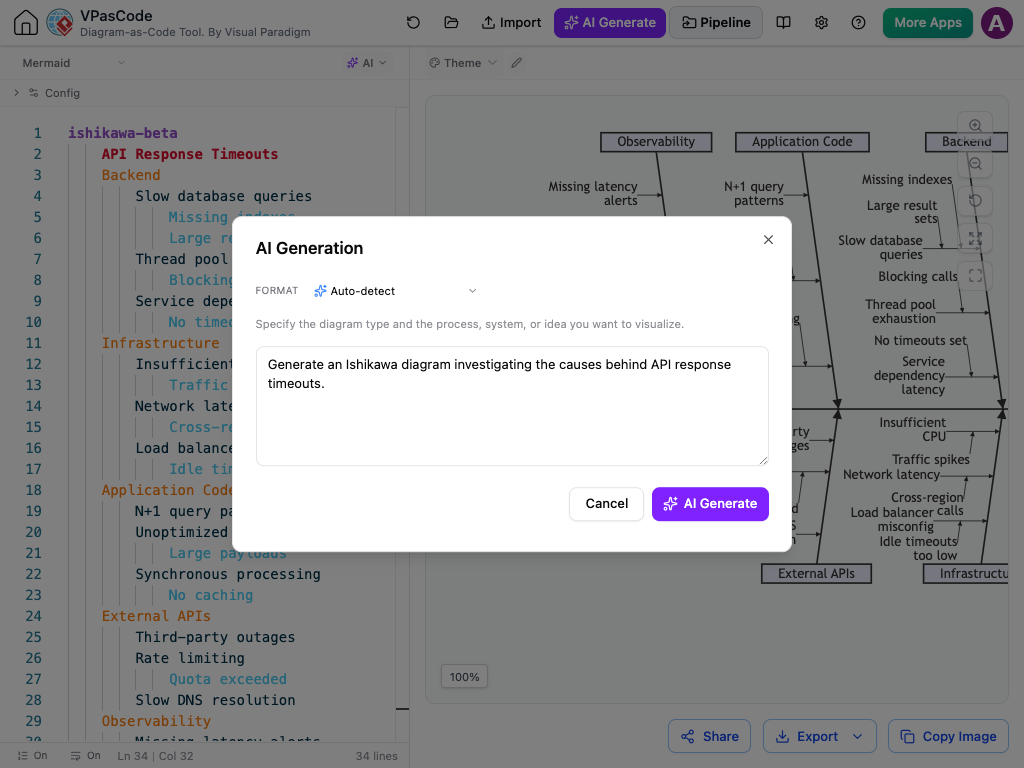
Instead of wrestling with canvas alignment or learning complex syntax, you can now construct complete cause-and-effect models using plain-English prompts directly within VPasCode.
Prompt: "Generate an Ishikawa diagram investigating the causes behind API response timeouts."In seconds, VPasCode’s AI engine analyzes your operational problem, categorizes primary vectors (such as Infrastructure, Application, Database, and Dependencies), and maps out sub-causes into a clear fishbone structure.
Example:
ishikawa-beta
    API Response Timeouts
    Backend
        Slow database queries
            Missing indexes
            Large result sets
        Thread pool exhaustion
            Blocking calls
        Service dependency latency
            No timeouts set
    Infrastructure
        Insufficient CPU
            Traffic spikes
        Network latency
            Cross-region calls
        Load balancer misconfig
            Idle timeouts too low
    Application Code
        N+1 query patterns
        Unoptimized serialization
            Large payloads
        Synchronous processing
            No caching
    External APIs
        Third-party outages
        Rate limiting
            Quota exceeded
        Slow DNS resolution
    Observability
        Missing latency alerts
        Incomplete tracing
            No span metrics
        Unclear timeout config
            Inconsistent values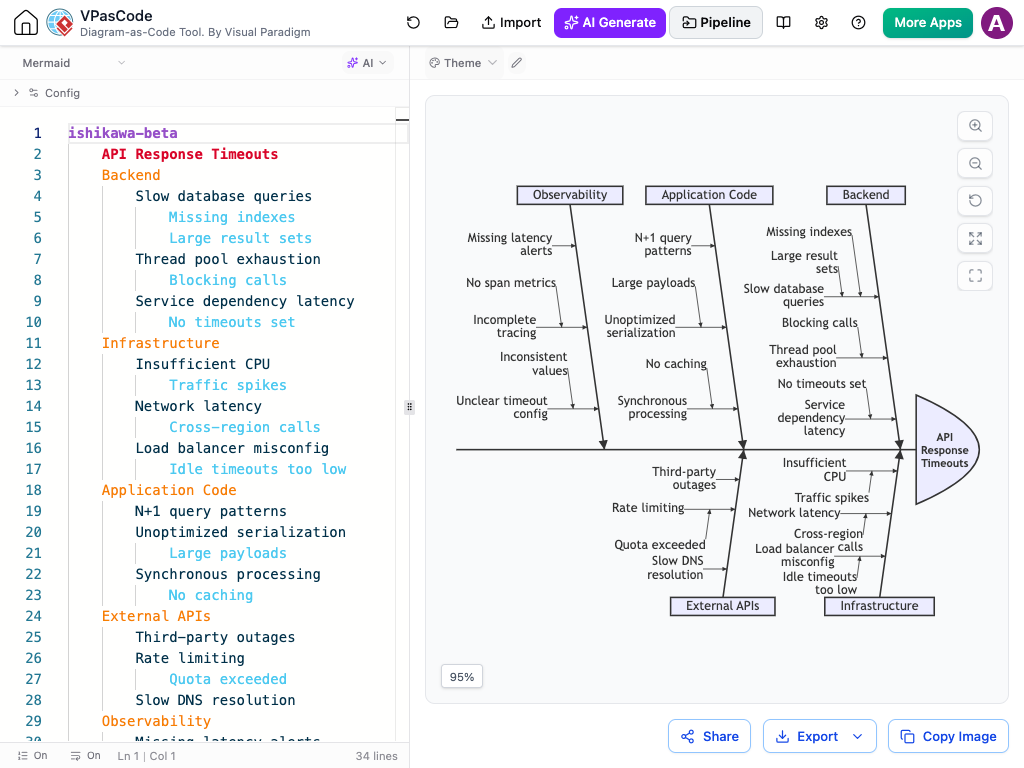
Expanding Diagram-as-Code with Mermaid Syntax
Standard diagram-as-code engines often struggle with flexible fishbone layouts. To solve this, Visual Paradigm introduced specialized Mermaid script structures for Ishikawa Diagrams, bringing cause-and-effect modeling into the text-based diagramming world.
You get the full benefit of lightweight, version-controlled scripts without having to draw a single line by hand.
Why Prompt-Driven Editing Wins
Because fishbone diagrams are brainstorming tools that grow dynamically during post-mortems, writing raw syntax or tweaking lines manually isn’t where your team should spend effort.
The real power of this update is conversational refinement:
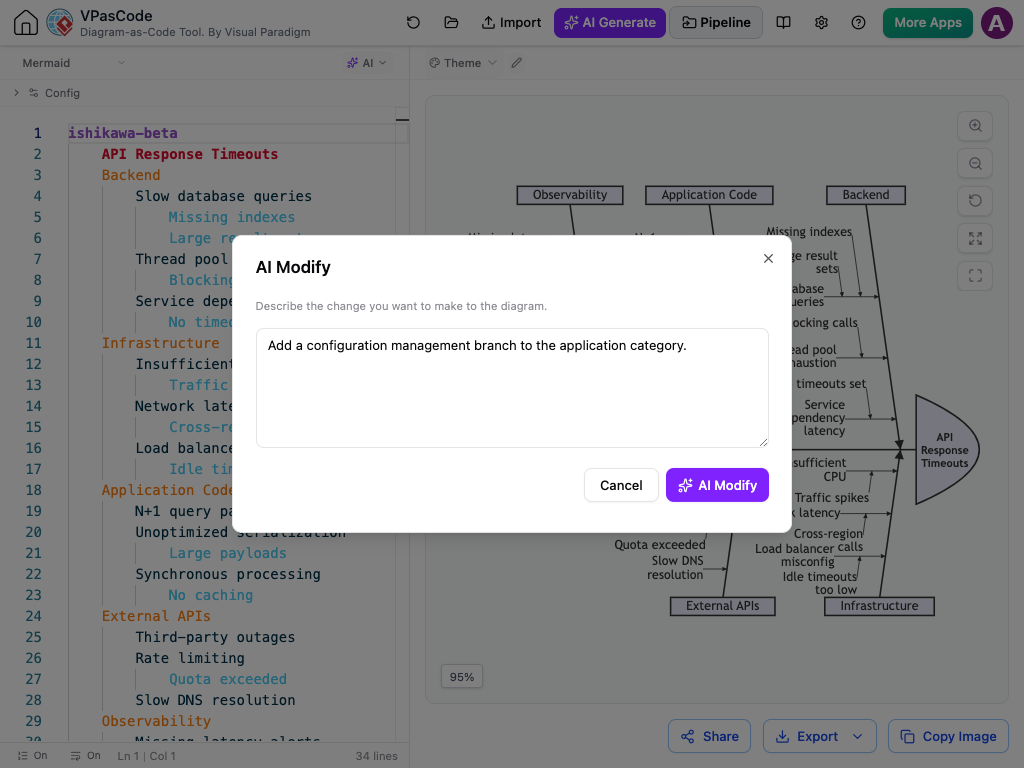
- Expand Categories: “Add a configuration management branch to the application category.”
- Drill Into Sub-causes: “Break down the database category into connection pool limits and slow query locks.”
- Reorganize Factors: “Move memory leak checks from infrastructure to application code.”
The AI updates the underlying Mermaid structure and re-renders the diagram instantly, allowing your team to analyze root causes at the speed of conversation.
Enterprise Knowledge Integration
Once your root cause analysis is finalized in VPasCode, you can seamlessly push the model into your engineering lifecycle:
- OpenDocs: Embed live Ishikawa diagrams directly into incident post-mortems, SLA reports, and root-cause documentation.
- NotesKeep: Preserve diagnostic steps and AI rationales as reference notes for future incident reviews.
- Vector Export: Download high-resolution SVG or PNG visual assets for engineering reviews and retrospectives.
👉 Learn more about the Ishikawa Diagram Generator
Eliminate Troubleshooting Friction
Open VPasCode today, describe your operational bottleneck, and let AI build and refine your Ishikawa Diagrams instantly.
👉 Try Ishikawa Diagram in VPasCode
Related posts:
 Introducing Visual Paradigm 18.1: A New Era of Unified Ecosystems and AI-Driven Innovation
 Seamless Diagram Lifecycle Management: Enhance and Edit AI-Generated Diagrams in Visual Paradigm OpenDocs via VPasCode
 Enhance Your Workflow: Generate and Visualize Structured JSON with Visual Paradigm AI Chatbot
 New Diagram Support: UML Communication Diagrams in VPasCode