


At Visual Paradigm, we are constantly looking for ways to make your visual creation experience smoother, faster, and more intuitive. Today, we are excited to introduce Code Formatting for ECharts in Visual Paradigm VPasCode—a feature designed directly with your usability in mind.
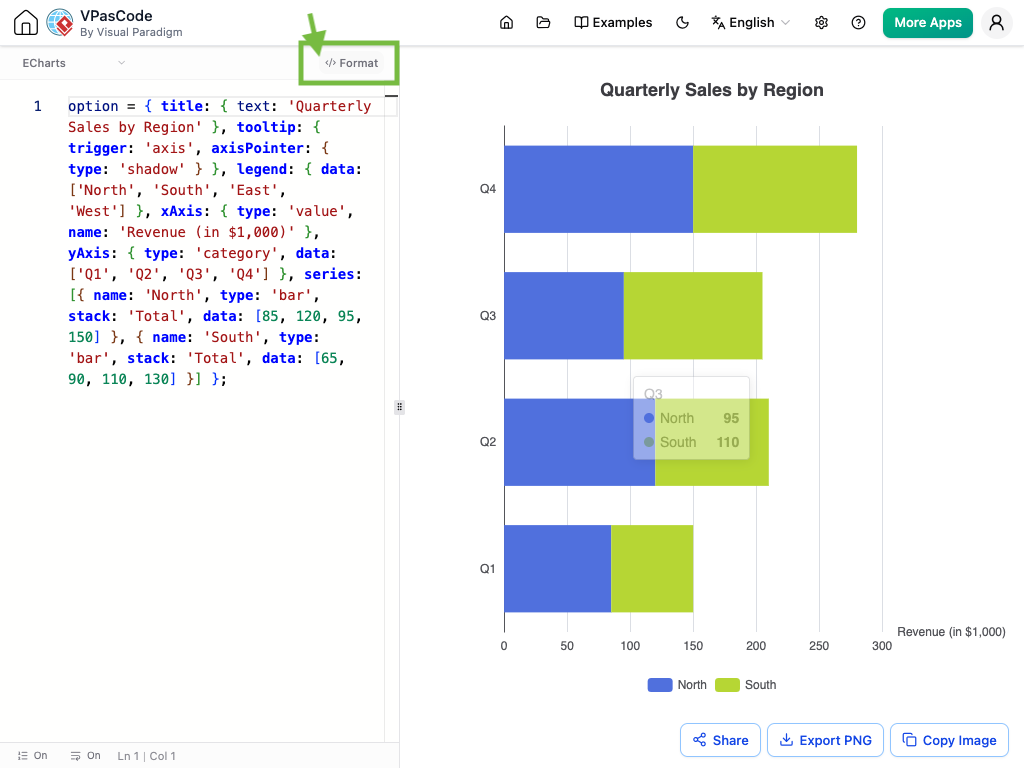
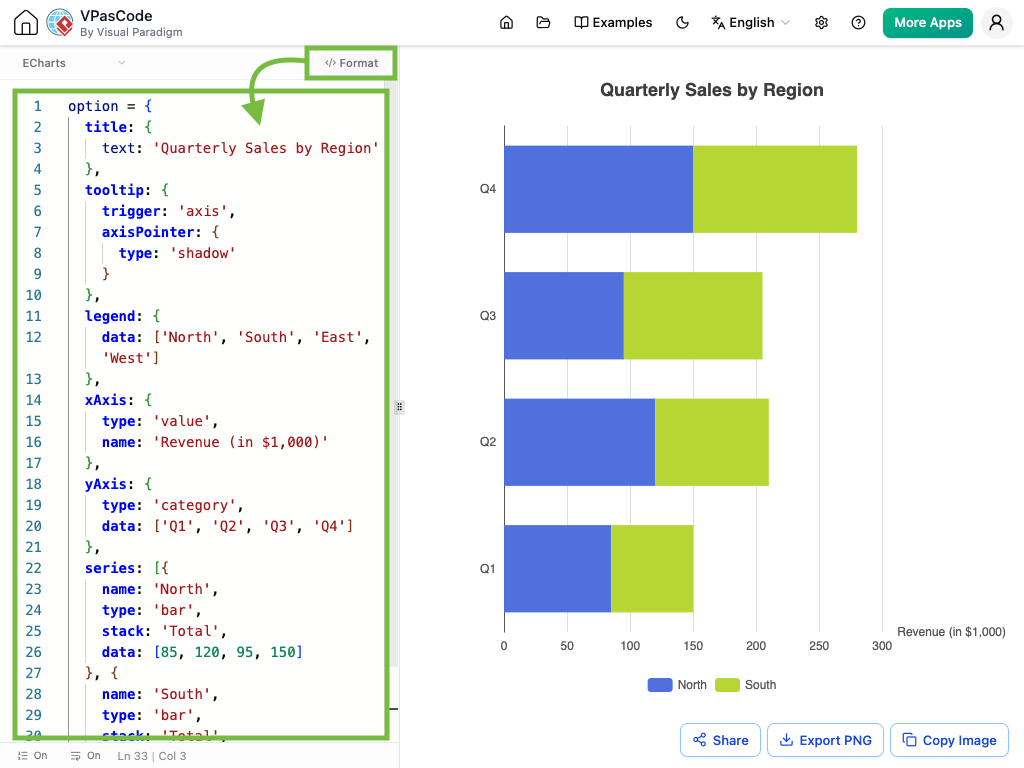
When working with complex chart scripts, readability is everything. Squeezing multiple attributes onto a single line makes it easy to miss details or make editing mistakes. With our new formatting tool, your code structure is transformed instantly:
-
Nothing Hidden: Every attribute is clearly listed on its own line, giving you total visibility over your chart’s structure.
-
Effortless Editing: Quickly locate and update labels, series data, or styling rules without hunting through packed lines of code.
-
One-Click Cleanup: Simply click the
</> Formatbutton at the top of the editor to instantly organize your script into clean, standard indentations.
Before
After
Try It Yourself!
See how much easier formatted code is to work with. Click Edit below to open this squeezed code in the editor, then hit </> Format to clean it up in one click:
option = { title: { text: 'Quarterly Sales by Region' },
tooltip: { trigger: 'axis', axisPointer: { type: 'shadow' } },
legend: { data: ['North', 'South', 'East', 'West'] },
xAxis: { type: 'value', name: 'Revenue (in $1,000)' },
yAxis: { type: 'category', data: ['Q1', 'Q2', 'Q3', 'Q4'] },
series: [{ name: 'North', type: 'bar', stack: 'Total', data: [85, 120, 95, 150] },
{ name: 'South', type: 'bar', stack: 'Total', data: [65, 90, 110, 130] }] };
Take Your Data Visualization to the Next Level
Stop wrestling with cluttered code. Design professional, interactive charts with ease using VPasCode.
Launch the Live VPasCode Editor Now →
Related posts:
 Meet the All-New AI Diagram Chatbot V2: The Next Generation of Intelligent Visual Modeling
 VPasCode Now Supports Chart Editing – Your Ultimate Chart Editor and Text-to-Diagram Platform
 VPasCode Expands Horizons: Introducing Native Markmap Support for Advanced Mind Mapping
 AI Chart Generation: Create with Chatbot, Edit with VPasCode