


हम आपको बताने के लिए उत्साहित हैं कि OpenDocs, हमारा शक्तिशाली AI-संचालित ज्ञान प्रबंधन उपकरण Visual Paradigm से। हमारे दस्तावेज़ीकरण और प्रोजेक्ट योजना कार्यप्रणाली को तेज करने के लगातार प्रतिबद्धता के हिस्से के रूप में, हम अब पूरी तरह से समर्थन करते हैं PERT चार्ट – बिना किसी रुकावट के AI उत्पादन क्षमताएं।
PERT चार्ट क्या है?
एक PERT चार्ट(कार्य आकलन और समीक्षा तकनीक) एक सिद्ध प्रोजेक्ट प्रबंधन दृश्यीकरण है जो कार्य, निर्भरताओं, माइलस्टोन और समयरेखा को नेटवर्क आरेख रूप में दर्शाता है। मूल रूप से अमेरिकी नौसेना द्वारा विकसित, PERT चार्ट प्रत्येक कार्य के लिए आशावादी, सबसे संभावित और निराशावादी समय अनुमानों का उपयोग करके अनिश्चितता के प्रबंधन में उत्कृष्ट है, जिससे टीमें क्रांतिक मार्ग की पहचान कर सकती हैं, योजनाओं को अनुकूलित कर सकती हैं और अधिक स्पष्टता और निर्दिष्टता के साथ जटिल प्रोजेक्ट का प्रबंधन कर सकती हैं।
चाहे आप प्रोजेक्ट प्रबंधक हों जो एकाधिक कार्यात्मक टीमों के निर्देशन कर रहे हों, व्यवसाय विश्लेषक हों जो डिलीवरेबल्स को रेखांकित कर रहे हों, या सॉफ्टवेयर वार्ड जो कार्यान्वयन चरणों की योजना बना रहे हों, PERT चार्ट प्रभावी प्रोजेक्ट योजना और जोखिम मूल्यांकन के लिए एक आवश्यक उपकरण बना रहता है।
OpenDocs में AI-संचालित PERT चार्ट निर्माण का परिचय
आज, हम खुशी से जोड़ रहे हैं PERT चार्ट OpenDocs में पूरी तरह से समर्थित आरेख प्रकारों की बढ़ती सूची में। यह हाल ही में जोड़े गए EPC आरेखों और घटक आरेखों के साथ जुड़ता है, जिससे आपके दृश्य कथा वर्णन के विकल्प और अधिक विस्तारित होते हैं।
हमारे उन्नत AI PERT चार्ट जनरेटर, आप अब पेशेवर, तैयार अनुकूलित करने योग्य PERT चार्ट सेकंड में – बस अपने प्रोजेक्ट का प्राकृतिक भाषा में वर्णन करें, और AI को बाकी काम सौंप दें। अब फिर से शुरुआत करने या हाथ से नोड स्थापना और तीर कनेक्शन के साथ लड़ने की आवश्यकता नहीं है।
नए PERT चार्ट समर्थन के मुख्य बिंदु:
- पाठ वर्णनों से AI उत्पादन – एक प्रोजेक्ट समीक्षा दर्ज करें (उदाहरण के लिए, “उपयोगकर्ता पंजीकरण, लेनदेन प्रसंस्करण और सुरक्षा प्रमाणीकरण चरणों के साथ मोबाइल बैंकिंग ऐप विकसित करें”), और AI को एक पूर्ण PERT नेटवर्क आरेख बनाते हुए देखें जिसमें कार्य, निर्भरताएं और अनुमानित समयरेखा शामिल हों।
- हमारे समृद्ध आरेख संपादक में पूर्ण संपादन – नोड (घटनाएं/माइलस्टोन), तीर (कार्य), समय अनुमान और लेबल को आपकी सटीक आवश्यकताओं के अनुसार कस्टमाइज़ करें।
- निरंतर एकीकरण – अपने को किसी भी OpenDocs पृष्ठ में एक लाइव आरेख घटक के रूप में एम्बेड करें, या एक निर्देशित घटक पृष्ठ बनाएं जिसके लिए एकाग्र दृश्य और सहयोग के लिए उपयोग किया जा सके।PERT चार्ट किसी भी OpenDocs पृष्ठ में एक लाइव आरेख घटक के रूप में, या एक निर्देशित घटक पृष्ठ बनाएं जिसके लिए एकाग्र दृश्य और सहयोग के लिए उपयोग किया जा सके।
- प्रोजेक्ट दस्तावेजीकरण के लिए आदर्श – अपने को एक सेंट्रलाइज्ड, साझा करने योग्य स्थान में विस्तृत नोट्स, आवश्यकताओं और अन्य आरेखों के साथ जोड़ें।PERT चार्ट विस्तृत नोट्स, आवश्यकताओं और अन्य आरेखों के साथ एक सेंट्रलाइज्ड, साझा करने योग्य स्थान में।
OpenDocs में AI PERT चार्ट टूल का उपयोग क्यों करें?
हमारा AI PERT चार्ट टूल प्रोजेक्ट योजना को निर्धारित गति से तेज करता है जबकि पेशेवर गुणवत्ता बनाए रखता है। उत्पादकता बढ़ाएं, हाथ से काम कम करें, और यह सुनिश्चित करें कि आपका दस्तावेजीकरण हमेशा स्पष्ट, संगत और दृश्य रूप से आकर्षक हो – सभी हमारे अनुकूल, वेब-आधारित AI-संचालित ज्ञान प्रबंधन उपकरण.
चाहे आप प्रोजेक्ट रोडमैप दस्तावेजीकरण कर रहे हों, क्रिटिकल पाथ का विश्लेषण कर रहे हों, या स्टेकहोल्डर्स के साथ प्रगति साझा कर रहे हों, OpenDocs जटिल विचारों को कार्यान्वयन योग्य दृश्यों में बदलने के लिए बहुत आसान बनाता है।
AI के साथ PERT चार्ट कैसे बनाएं?
- पर क्लिक करें सम्मिलित करें अपने दस्तावेज संपादक के शीर्ष बार में बटन।

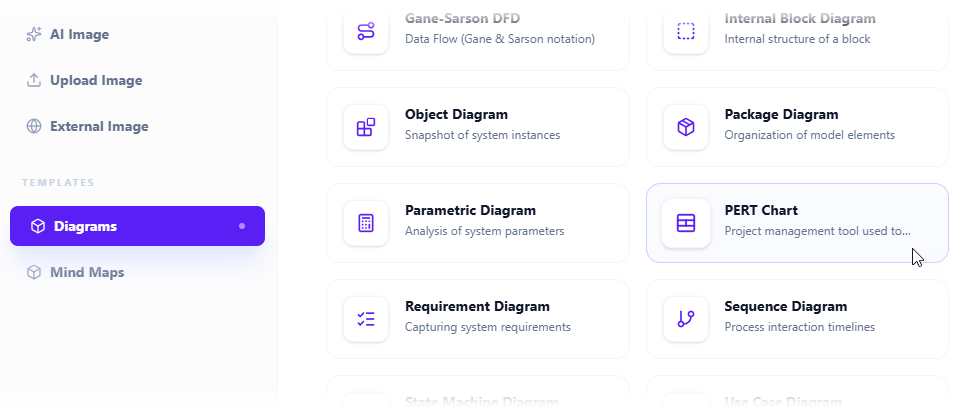
- द सम्मिलित करें डायलॉग बॉक्स खुलता है। चुनें आरेख बाएं तरफ के टैब, और फिर PERT चार्ट दाएं तरफ।
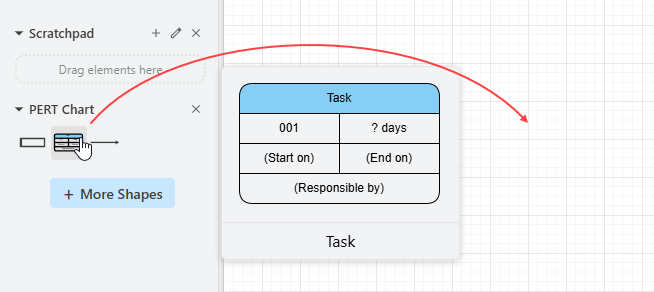
- यह आरेख संपादक खोलता है। आप पैलेट पर स्थित प्रतीकों का उपयोग करके PERT चार्ट बना सकते हैं (बस एक प्रतीक को आरेख कैनवास पर खींचकर रखें)।
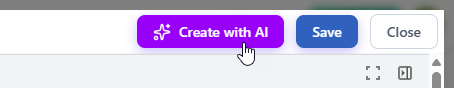
AI के साथ एक आरेख उत्पन्न करने के लिए, पर क्लिक करें AI के साथ बनाएं ऊपर दाएं तरफ।
- इनपुट बॉक्स में अपनी समस्या का वर्णन करें। क्लिक करें उत्पन्न करें.
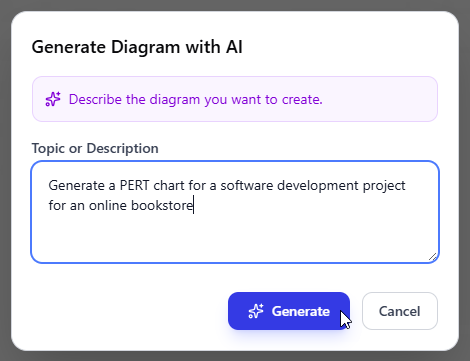
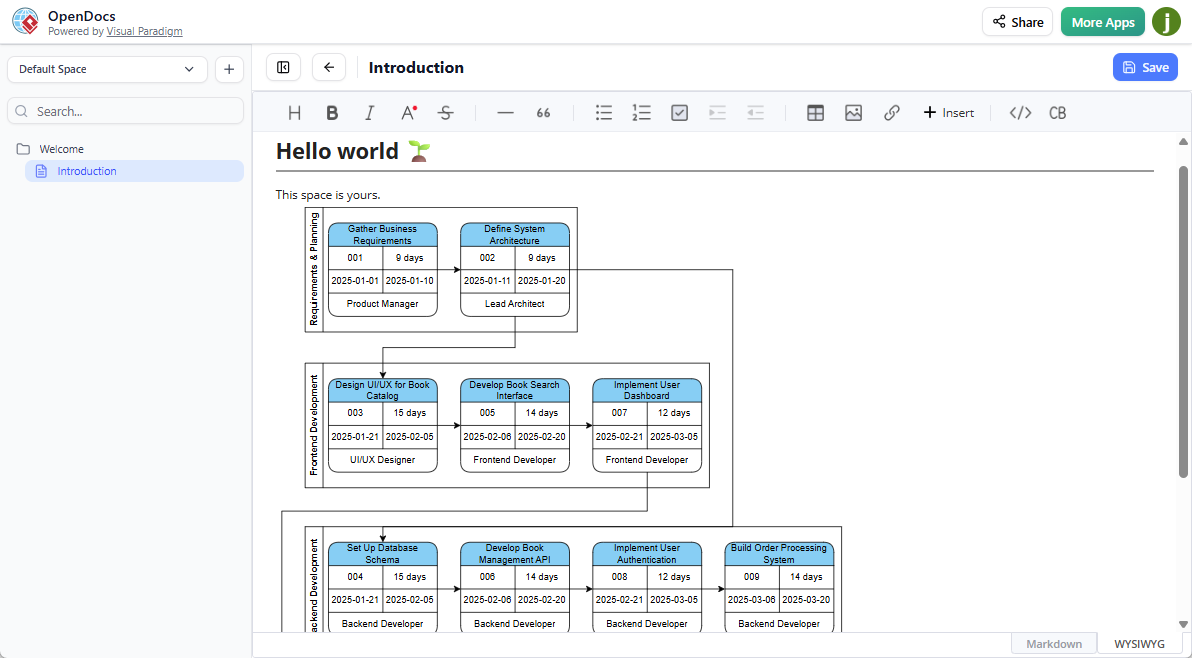
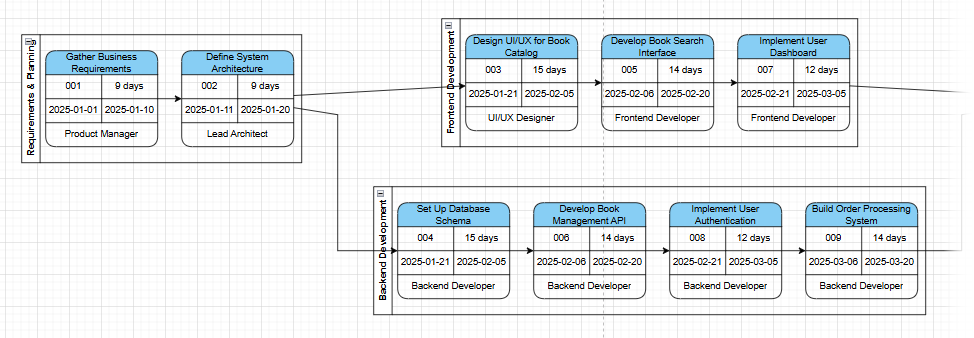
- AI आपकी समस्या का विश्लेषण करेगा और संबंधित PERT चार्ट उत्पन्न करेगा। नीचे उत्पन्न एक उदाहरण दिया गया है।
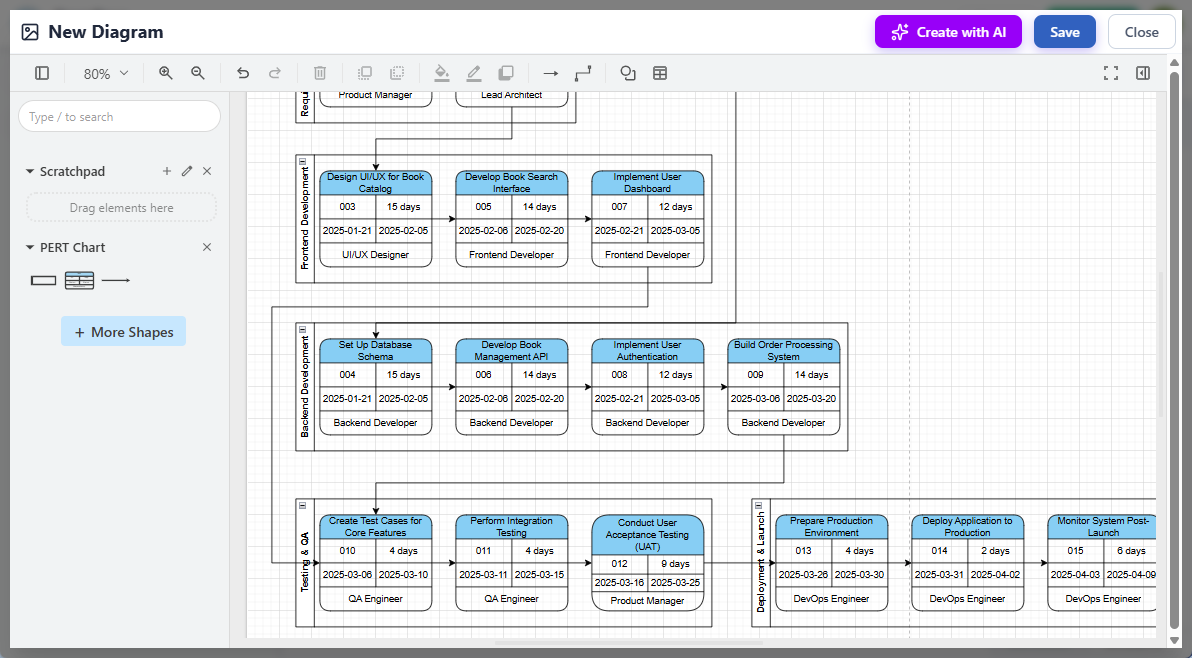
- लेआउट को समायोजित करने, नए आकृतियाँ जोड़ने आदि द्वारा PERT चार्ट को सुधारें।
- क्लिक करें सहेजेंऊपर दाएं कोने में।
- क्लिक करें बंद करेंदस्तावेज संपादक पर लौटने के लिए। आरेख आपके दस्तावेज में एम्बेड किया गया है।
आज ही AI-संचालित PERT चार्ट के साथ शुरुआत करें
AI-सहायता वाले प्रोजेक्ट दृश्यीकरण की शक्ति का अनुभव करने के लिए तैयार हैं? अभी जाएं OpenDocs ऐप अब और अपना पहला बनाना शुरू करें PERT चार्ट – यह आपके Visual Paradigm Online (कॉम्बो संस्करण) या प्रोफेशनल संस्करण लाइसेंस के साथ शामिल है।
इस रोमांचक नई सुविधा के बारे में अधिक जानें और हमारे समर्पित लैंडिंग पेज पर सभी समर्थित आरेख प्रकार का अन्वेषण करें: OpenDocs – AI-संचालित दस्तावेज़ीकरण और आरेखण.
टीम, विश्लेषक, इंजीनियर और प्रोजेक्ट नेताओं के लिए शक्तिशाली नई क्षमताओं के साथ OpenDocs के विस्तार के बारे में अपडेट्स के लिए जुड़े रहें।
Visual Paradigm टीम