


At Visual Paradigm, we are continuously refining our artificial intelligence tools to better match how human professionals think, collaborate, and structure data. Last week, we celebrated the launch of our Next-Gen AI Diagramming Chatbot V2, which introduced a major architectural leap in conversational diagramming. Today, we are excited to spotlight a targeted powerhouse enhancement built directly into that engine: a completely reimagined way to generate Organization Charts.
Why Smarter Structure Matters for Organization Charts
An organization chart is more than a list of reporting lines; it is a visual representation of a company’s operational DNA, departmental boundaries, and functional ecosystems. Previously, our AI Chatbot built technically precise reporting hierarchies. They were accurate, clean, and functional. However, real-world organizational design requires more than linear top-down lines—it thrives on logical partitioning.
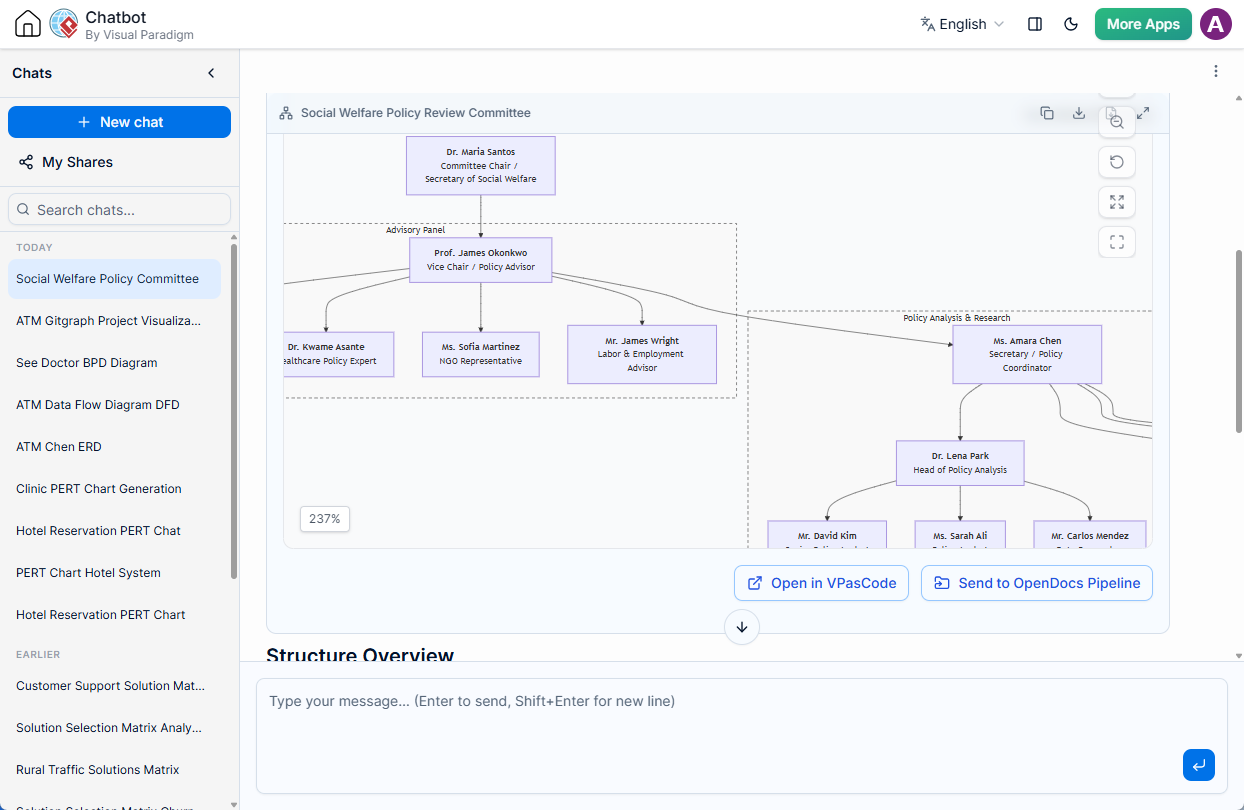
With our latest enhancement, the AI Diagramming Chatbot does not just map out who reports to whom. It now dynamically analyzes the functional contexts of your prompt to group roles logically into explicit departments, squads, or divisions using structural subgraphs. This gives your charts an immediate layer of operational clarity, making complex enterprise hierarchies effortlessly readable in a single glance.
The Enhancement in Action: From Prompt to Structural Subgraphs
To see how this functional grouping elevates clarity, look at the structural output generated by the chatbot when given a complex, multi-layered mandate. When a user prompted the AI with: “Generate an Organization Chart for a social welfare policy review committee,” the chatbot automatically clustered specialized roles into distinct, visually bounded divisions like Policy Analysis, Legal, and Community Engagement.
Below is the clean, production-ready Mermaid.js code generated directly by the chatbot session:
---
title: Social Welfare Policy Review Committee
vpDiagramType: OrganizationChart
---

flowchart TB
    Chair["`**Dr. Maria Santos**<br>Committee Chair / Secretary of Social Welfare`"]

    Vice["`**Prof. James Okonkwo**<br>Vice Chair / Policy Advisor`"]

    Chair --> Vice

    %% Core Secretariat
    Sec["`**Ms. Amara Chen**<br>Secretary / Policy Coordinator`"]

    Vice --> Sec

    %% Policy Analysis Division
    subgraph PolicyDiv ["Policy Analysis & Research"]
        style PolicyDiv fill:#f9f9f9,stroke:#333,stroke-width:1px,stroke-dasharray: 5 5
        Sec --> PolLead["`**Dr. Lena Park**<br>Head of Policy Analysis`"]
        PolLead --> Pol1["`**Mr. David Kim**<br>Senior Policy Analyst`"]
        PolLead --> Pol2["`**Ms. Sarah Ali**<br>Policy Analyst`"]
        PolLead --> Pol3["`**Mr. Carlos Mendez**<br>Data Researcher`"]
    end

    %% Legal & Compliance Division
    subgraph LegalDiv ["Legal & Compliance"]
        style LegalDiv fill:#f9f9f9,stroke:#333,stroke-width:1px,stroke-dasharray: 5 5
        Sec --> LegalLead["`**Ms. Priya Sharma**<br>Head of Legal Affairs`"]
        LegalLead --> Legal1["`**Mr. Tom Brooks**<br>Compliance Officer`"]
        LegalLead --> Legal2["`**Ms. Fatima Osei**<br>Legislative Liaison`"]
    end

    %% Stakeholder & Community Engagement
    subgraph CommDiv ["Community & Stakeholder Engagement"]
        style CommDiv fill:#f9f9f9,stroke:#333,stroke-width:1px,stroke-dasharray: 5 5
        Sec --> CommLead["`**Mr. Andre Ng**<br>Director of Engagement`"]
        CommLead --> Comm1["`**Ms. Rosa Torres**<br>Community Outreach Officer`"]
        CommLead --> Comm2["`**Mr. Liam O'Brien**<br>Public Consultation Lead`"]
    end

    %% Finance & Budget Division
    subgraph FinanceDiv ["Finance & Budget Oversight"]
        style FinanceDiv fill:#f9f9f9,stroke:#333,stroke-width:1px,stroke-dasharray: 5 5
        Sec --> FinLead["`**Dr. Helen Zhou**<br>Head of Budget & Finance`"]
        FinLead --> Fin1["`**Mr. Raj Patel**<br>Budget Analyst`"]
        FinLead --> Fin2["`**Ms. Grace Njoroge**<br>Grants Coordinator`"]
    end

    %% Advisory Panel
    subgraph AdvisoryPanel ["Advisory Panel"]
        style AdvisoryPanel fill:#f9f9f9,stroke:#333,stroke-width:1px,stroke-dasharray: 5 5
        Vice --> Adv1["`**Prof. Emily Watson**<br>Academic Advisor`"]
        Vice --> Adv2["`**Dr. Kwame Asante**<br>Healthcare Policy Expert`"]
        Vice --> Adv3["`**Ms. Sofia Martinez**<br>NGO Representative`"]
        Vice --> Adv4["`**Mr. James Wright**<br>Labor & Employment Advisor`"]
    end
You can view the full, interactive course of this live generation and see exactly how the AI structures these relationships by visiting the shared AI Chatbot session link.
Interactive Iteration: Refining Your Org Chart via Chat
While generating an incredibly structured chart in one shot is powerful, enterprise realities often require modifications. The core strength of the Visual Paradigm AI Chatbot home page experience is its conversational elasticity. If your initial chart requires a shift—such as moving a team under a different executive, adding novel agile squads, or renaming divisions—you do not have to start over. Simply talk to the bot. Natural language instructions like “Move the Budget Oversight division directly under the Chair” or “Add an Associate Analyst to Ms. Sarah Ali’s team” are compiled instantly into the diagram structure.
Advanced Post-Generation Workflows: VPasCode and OpenDocs
The value of your organization chart doesn’t end when the chat conversation stops. We have engineered a seamless pipeline to take your AI-generated asset into professional editing and corporate documentation spaces:
1. Instant Code-Level Editing via VPasCode
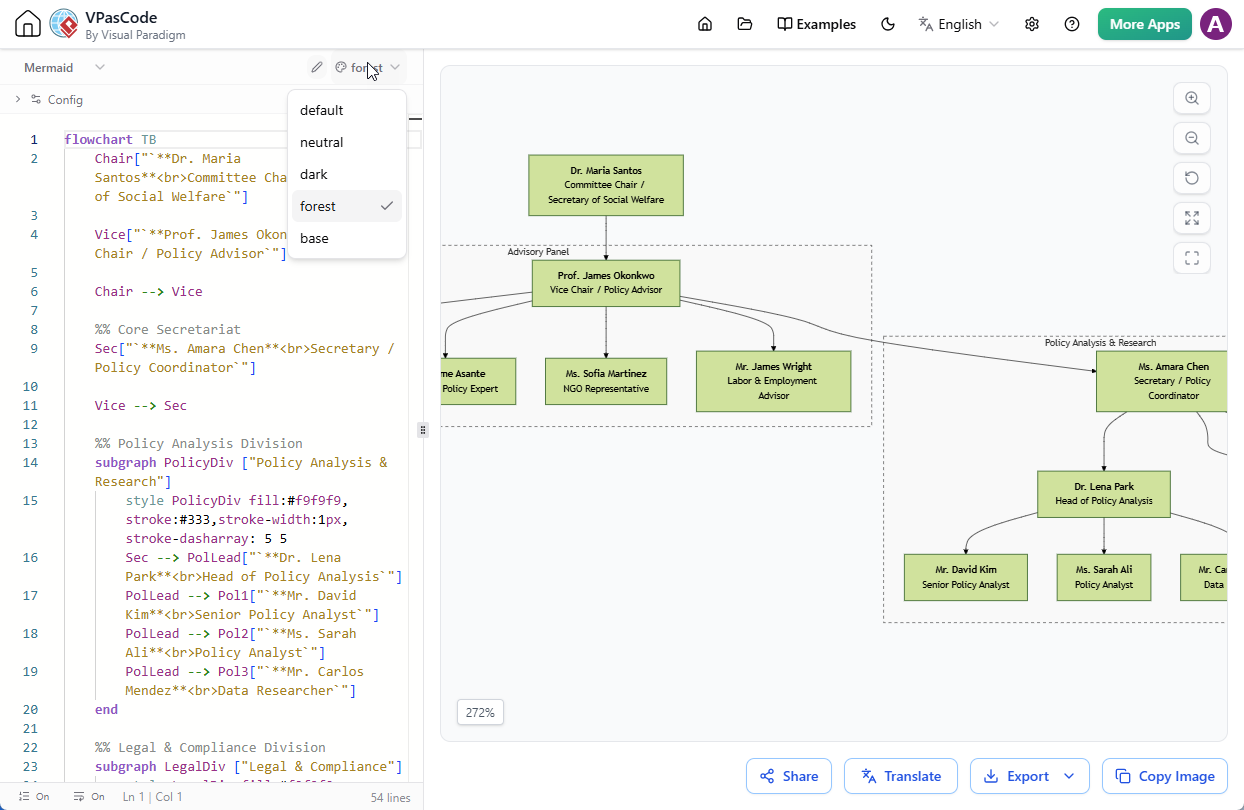
Every diagram viewer inside the chatbot interface features an Open in VPasCode button. Clicking this bridges your session directly into Visual Paradigm VPasCode, our premium diagram-as-code engineering platform. From this interface, you can manually tinker with the Mermaid syntax, tweak stylistic values, alter text, and watch modifications render in real time before exporting high-resolution images for your presentations or corporate handbooks.
2. Direct Pipeline to Visual Paradigm OpenDocs
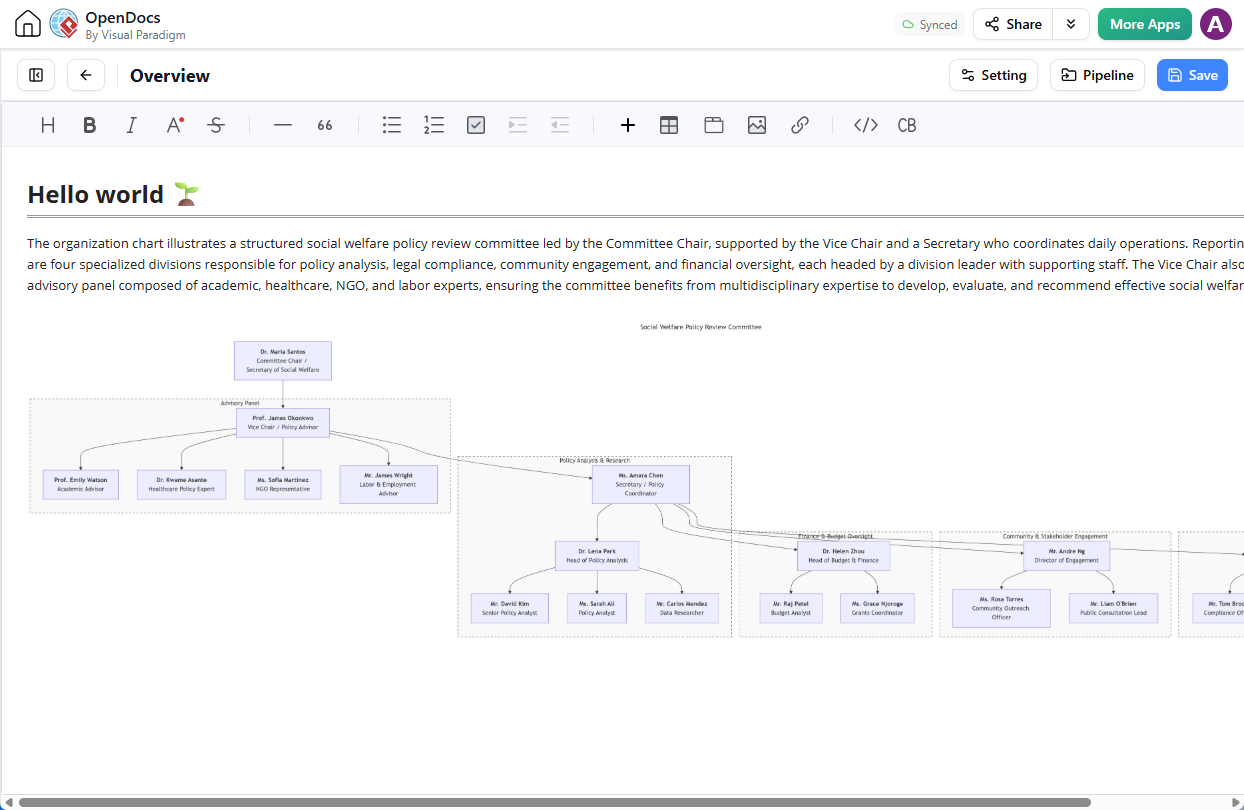
For cross-functional alignment and knowledge management, you can route your chart straight to your documentation base. By clicking Send to OpenDocs Pipeline, your diagram is queued directly into your organizational knowledge pipeline. Open your active project within OpenDocs, open the Pipeline panel, and drag the chart right onto your wiki, portal, or policy page. For a full breakdown on managing this workflow, read our related article: New Feature Alert: Send Diagrams from Visual Paradigm AI Chatbot Directly to OpenDocs!
Build Meaningful Corporate Maps Today
Whether you are mapping out a construction project, an agile development group, an executive leadership team, or a cross-functional policy review board, our enhanced AI engine delivers the logical boundaries your charts deserve.
Ready to experience the new standard in automated corporate diagramming? Hop into the application right now and run your first prompt.