


Download Visual Paradigm Desktop
✨ Related Update: AI Diagram Generator Now Supports 13+ Diagram Types. Learn More
The Challenge of Multi-Dimensional Data Analysis
Analyzing entities based on several variables (e.g., comparing three products across five features, or comparing an employee’s performance across six skills) is inherently difficult using standard bar or line graphs. This process traditionally involved meticulous calculation and manual scaling to ensure all metrics were presented accurately on a single visualization.
Common pain points in data visualization included:
- Complexity: Difficulty in comparing performance across more than two axes simultaneously.
- Manual Effort: The time required to set up the axes, calculate proportional scaling, and plot points correctly.
- Clarity: Traditional tables often obscure patterns and overall profiles.
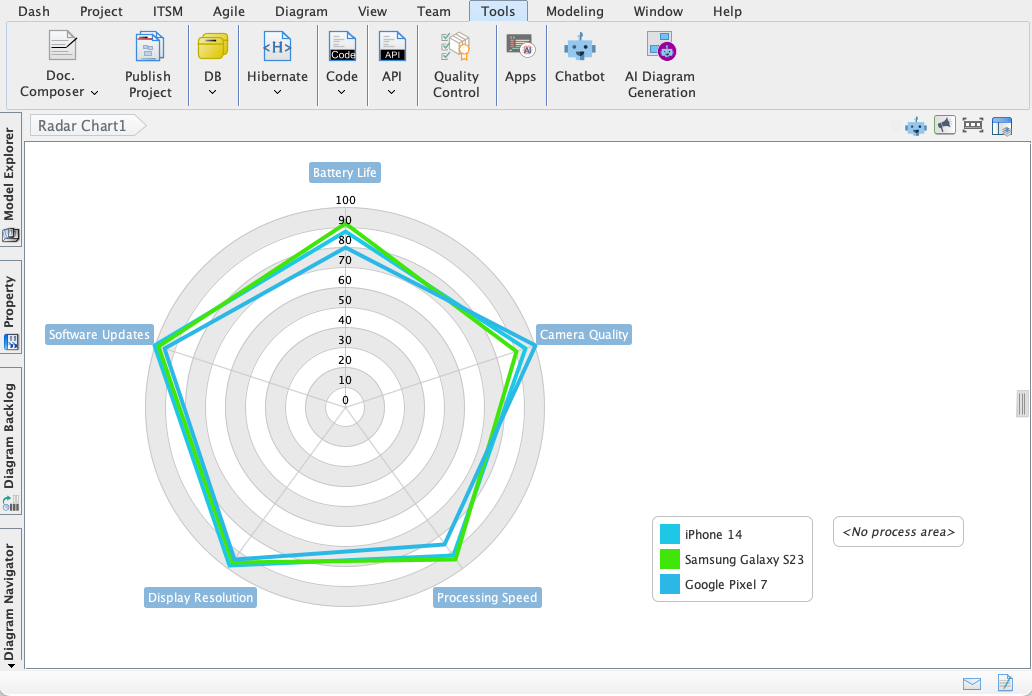
Automated Insight: The AI Diagram Generator for Radar Charts
The AI Diagram Generator now resolves these issues by instantly constructing the Radar Chart based on your textual description. Simply tell the AI what you want to compare and the metrics involved, and the visualization appears, ready for refinement and inclusion in your reports.
This powerful new capability enables you to:
- Visualize Performance Profiles: Instantly map out profiles for individuals, teams, or products to identify areas needing improvement.
- Conduct Quick Comparisons: Overlay multiple data sets on a single chart for immediate comparative analysis (e.g., “Actual vs. Target Performance”).
- Customize Axes: Define the number of spokes or dimensions of the chart through simple natural language input.
- Save Valuable Time: Eliminate the manual plotting process, allowing you to focus on interpreting the data rather than generating the chart.
Generate Your First Radar Chart in Seconds
Creating an insightful Radar Chart with the new AI Diagram Generator is a streamlined process:
- Click on Tools from the toolbar.
- Select AI Diagram Generation
- Select Radar Chart from the Diagram Type Menu
- Enter a Topic
- See instant results
Unlock Deeper Data Insights
The addition of the Radar Chart confirms Visual Paradigm’s commitment to providing versatile, AI-accelerated visualization tools. Whether you are evaluating architectural options, summarizing complex technical performance data, or assessing organizational skills, the AI Diagram Generator gives you the immediate visual clarity you need.
Update your Visual Paradigm Desktop application today and start transforming your multi-dimensional data into sharp, informative Radar Charts instantly!