
Visual Paradigm has enhanced its AI Diagramming Chatbot with support for two additional C4 model diagram types: C4 System Landscape Diagrams and C4 Dynamic Diagrams.
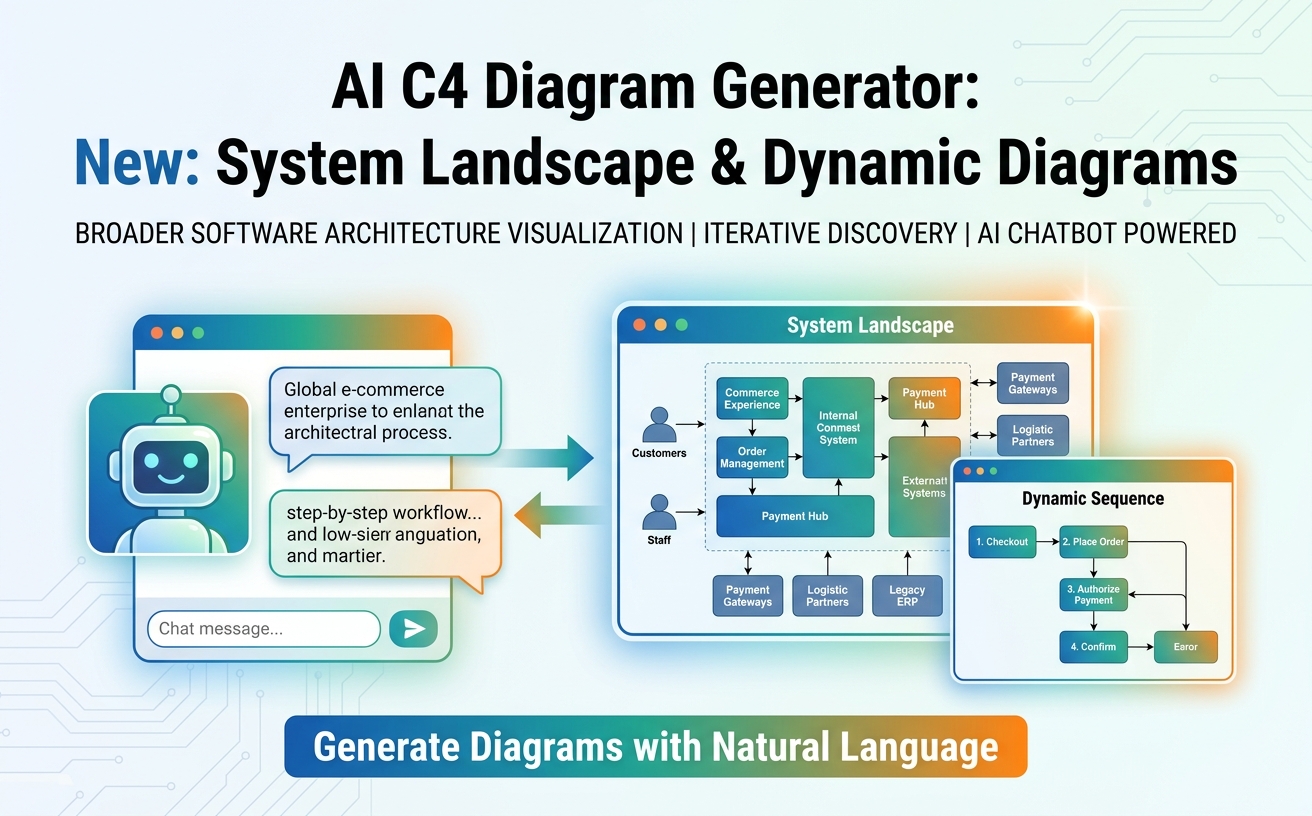
With this update, architects, developers, business analysts, project teams, and technical communicators can use natural-language prompts to generate a broader range of software architecture diagrams. The AI C4 Diagram tool can now help users move from a high-level view of an organization’s systems to a detailed view of how those systems interact during a specific workflow.
The new capabilities extend the chatbot’s existing support for C4 System Context, C4 Container, C4 Component, and C4 Deployment diagrams. Together, these diagram types provide a practical way to explore software architecture at different levels of abstraction—from the surrounding technology ecosystem to the internal components and runtime interactions of a system.
Try the AI C4 Diagram generator now and describe the architecture you want to visualize.
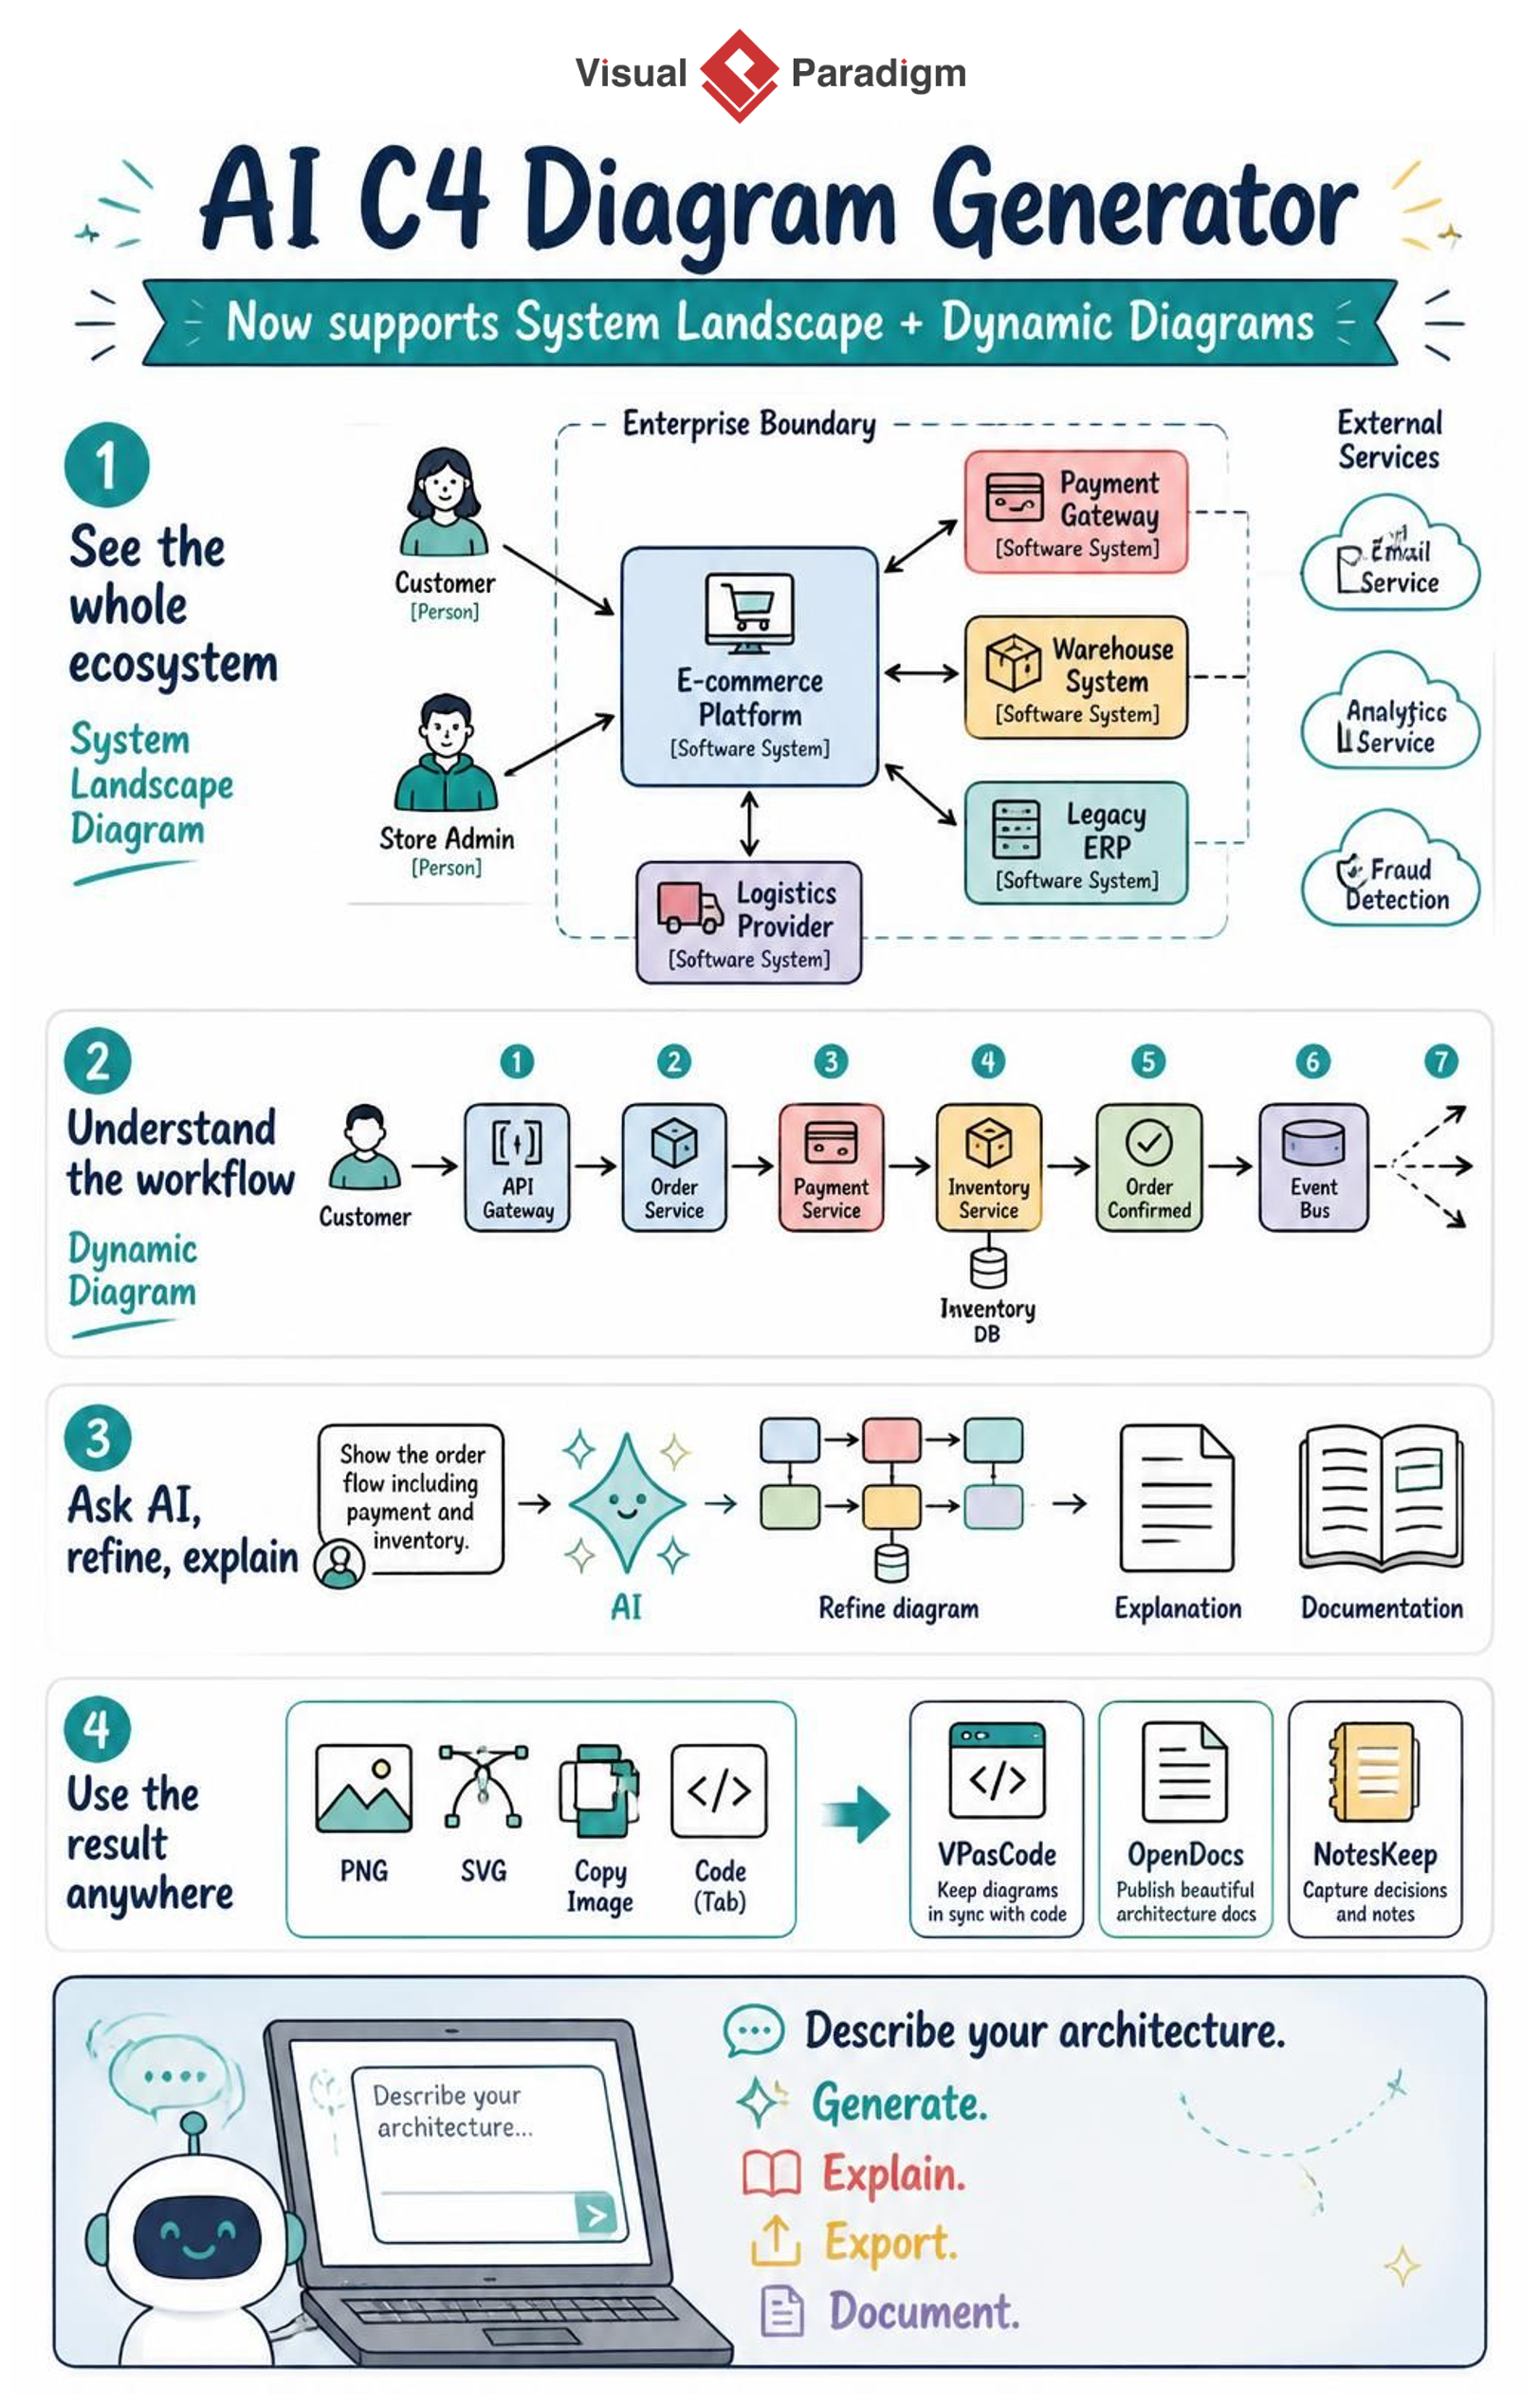
Before you continue, please have a look at the infographic below that shows you the core concepts of this announcement.
What is new in the AI C4 Diagram tool?
The Visual Paradigm AI Diagramming Chatbot can now generate:
- C4 System Landscape Diagrams that show the systems, people, organizations, and external services surrounding an enterprise or software system.
- C4 Dynamic Diagrams that illustrate how containers or other architectural elements interact to complete a particular use case or business scenario.
These additions are important because architecture understanding requires more than a static view of system boundaries. Teams also need to understand the broader landscape in which a system operates and the sequence of interactions that make a business process work.
A C4 System Landscape Diagram is useful when the main question is: What systems and external actors are involved in this environment?
A C4 Dynamic Diagram is useful when the main question is: How do these systems or containers collaborate to complete a specific scenario?
By supporting both views, the AI C4 Diagram generator helps teams connect strategic architecture conversations with implementation-level workflows.
Why C4 System Landscape and Dynamic Diagrams matter
The C4 model is widely used to communicate software architecture through a set of complementary diagrams. Each diagram answers a different question and is intended for a different level of detail.
Context diagrams explain the relationship between a system, its users, and external systems. Container diagrams show the major applications, services, databases, and message queues inside a system. Component diagrams explain the internal structure of a container. Deployment diagrams show where software runs in a technical environment.
The newly supported diagrams add two highly useful perspectives:
- The System Landscape Diagram broadens the view beyond one software system and helps stakeholders understand the complete technology environment.
- The Dynamic Diagram adds behavior and sequence, showing how architectural elements collaborate in a selected scenario.
This makes the AI C4 Diagram tool more useful for architecture discovery, system planning, integration analysis, onboarding, technical reviews, modernization initiatives, and documentation.
Understand the architecture beyond a single system
Many enterprise systems do not operate in isolation. An e-commerce platform may depend on payment gateways, warehouse systems, logistics providers, tax authorities, accounting services, customer relationship management platforms, and legacy enterprise resource planning systems.
A System Landscape Diagram brings these relationships into one visual view. It helps teams identify:
- Which systems are owned and operated by the enterprise
- Which actors interact with the architecture
- Which third-party services support critical business capabilities
- Where legacy systems remain part of the operating landscape
- How data and business processes move between systems
- Which integrations use APIs, messaging, batch processing, file transfer, or other technologies
This is particularly valuable during enterprise architecture planning, platform modernization, merger and acquisition analysis, integration planning, and system dependency reviews.
Explain how a business scenario actually works
A landscape diagram shows what exists. A Dynamic Diagram shows what happens.
For example, an order placement workflow may begin when a customer submits a checkout request through an API Gateway. The request may then be routed to an Order Service, stored in an Order Database, sent to a Payment Service, authorized by a third-party payment gateway, and checked against an Inventory Service. Once payment and inventory are confirmed, the order can be marked as confirmed and published to an event bus for downstream fulfillment, notification, and analytics processes.
A C4 Dynamic Diagram makes this workflow easier to discuss because it presents the interactions in an ordered, scenario-focused view. Architects can use it to identify dependencies, synchronous calls, asynchronous events, potential failure points, and compensation flows.
Example: Generate a C4 System Landscape Diagram with AI
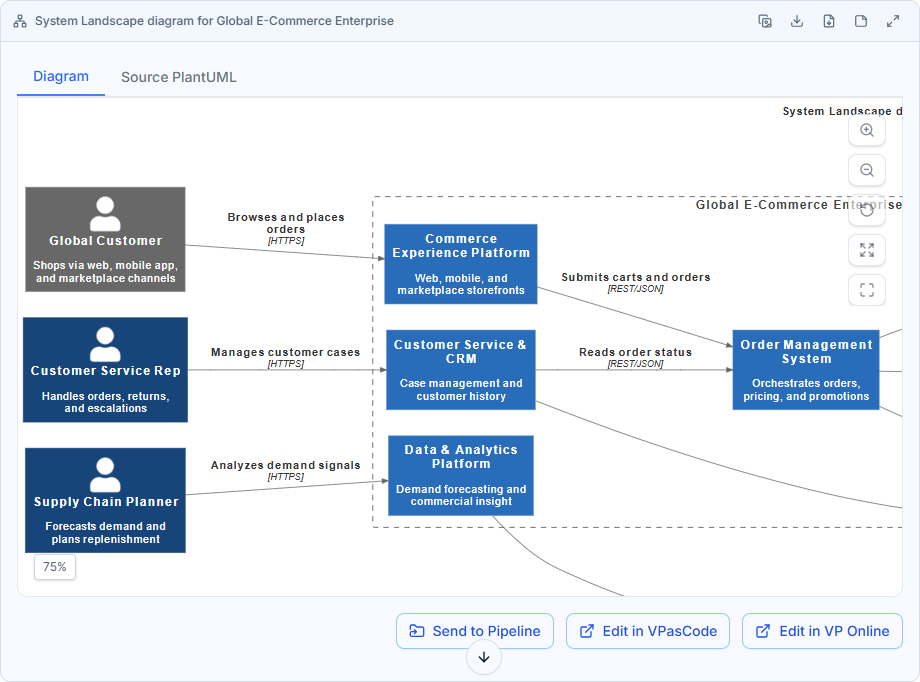
To demonstrate the new feature, we used the AI Diagramming Chatbot to generate a landscape diagram for a global e-commerce enterprise.
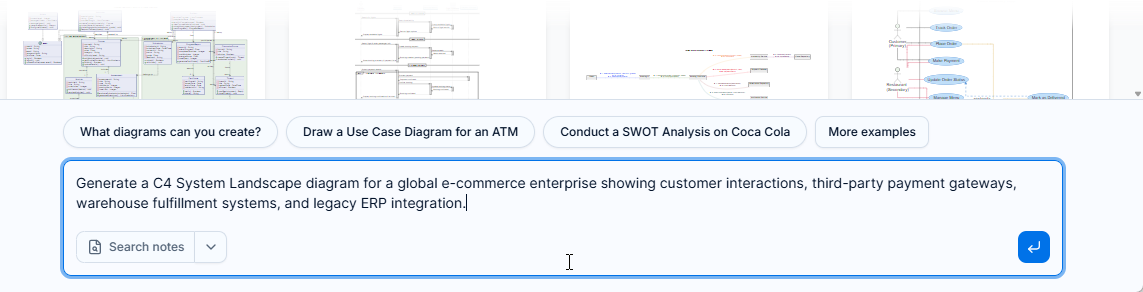
The prompt was:
Generate a C4 System Landscape diagram for a global e-commerce enterprise showing customer interactions, third-party payment gateways, warehouse fulfillment systems, and legacy ERP integration.
The AI C4 Diagram generator produced a landscape containing the external participants, the enterprise scope, major systems, etc.
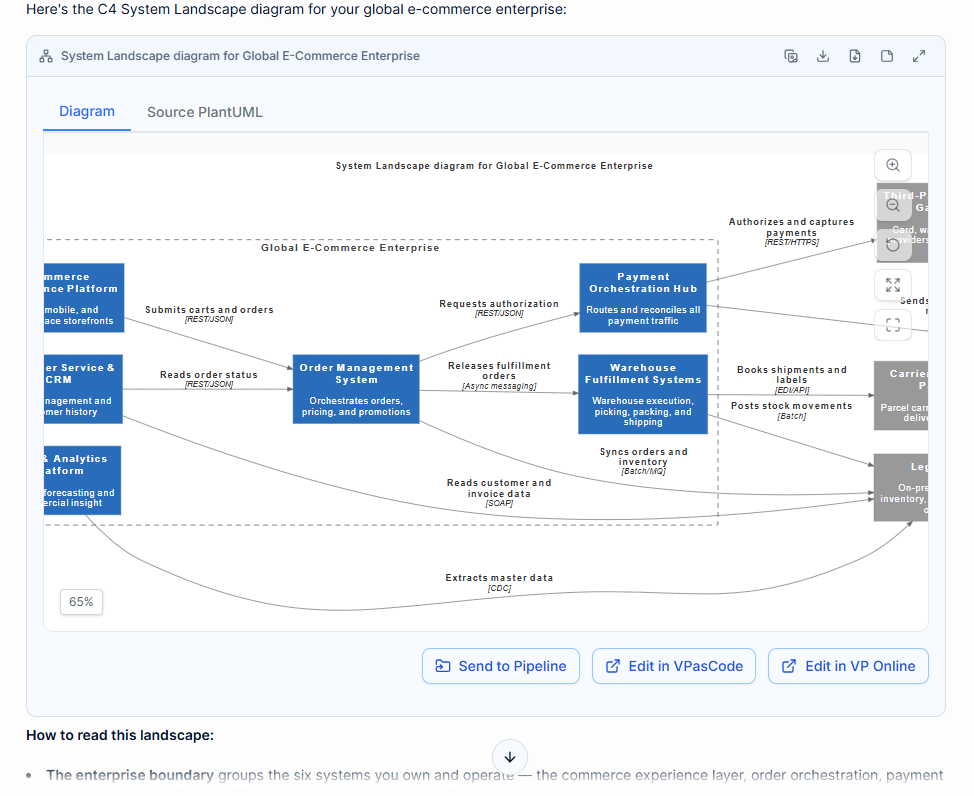
The generated relationships were also labeled with meaningful interaction descriptions and technologies, such as REST, HTTPS, asynchronous messaging, batch processing, SFTP, EDI, SOAP, and change data capture.
This makes the generated diagram more than a collection of boxes and arrows. It provides a starting point for discussing system ownership, integration styles, operational dependencies, and modernization priorities.
View the shared example conversation to see how the AI C4 Diagram tool generated the C4 System Landscape Diagram.
Example: Generate a C4 Dynamic Diagram with AI
After generating the landscape diagram, we asked the AI C4 Diagram generator to describe a specific workflow within the e-commerce platform.
The prompt was:
Generate a C4 Dynamic diagram within the E-Commerce Platform showing the step-by-step workflow for a customer placing an order via the API Gateway.
The resulting Dynamic Diagram showed the interaction between the customer, the platform and external systems.
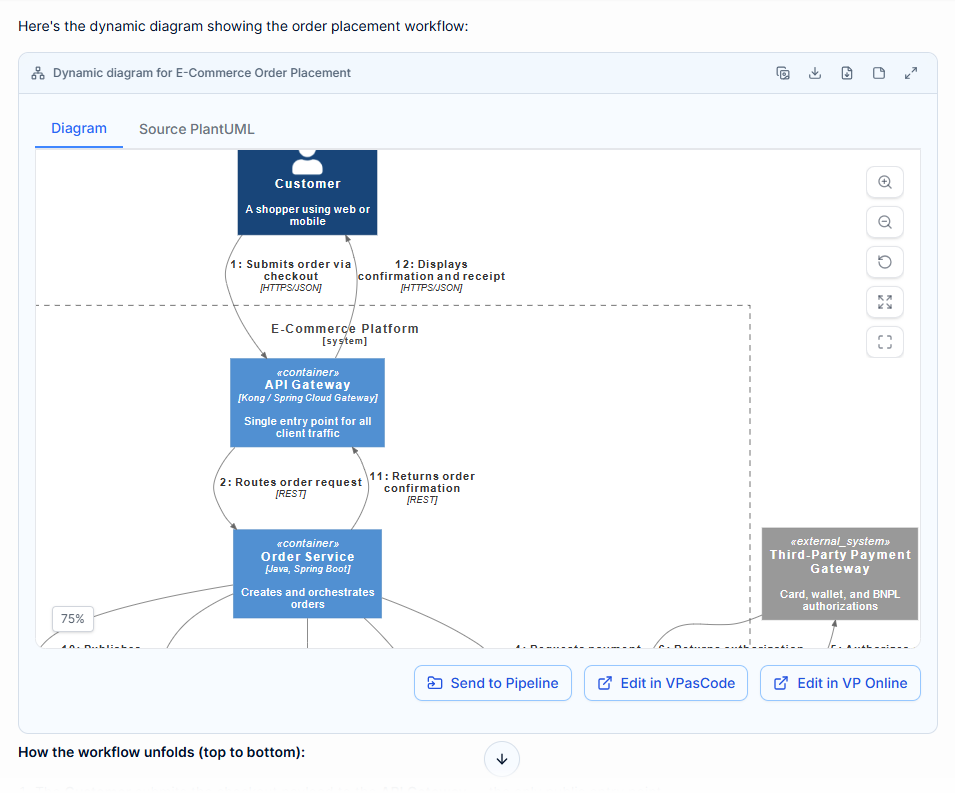
This example demonstrates how a C4 Dynamic Diagram can complement a C4 System Landscape Diagram. The landscape explains the complete ecosystem, while the Dynamic Diagram focuses on one important use case inside that ecosystem.
From natural-language prompt to architecture diagram
Creating architecture diagrams manually can be time-consuming, especially when the initial requirement is still incomplete or expressed in informal business language. Teams may know what they want to explain but not yet have a precise visual structure in mind.
The AI Diagramming Chatbot provides a conversational approach. Users can describe the system, scenario, stakeholders, technologies, or integration requirements in plain language. The AI then generates a diagram that can be reviewed and refined through follow-up instructions.
For example, after generating a C4 Dynamic Diagram, a user can ask the AI to:
- Add a fraud detection service
- Show the payment decline path
- Include an inventory shortfall scenario
- Represent the order event bus as an asynchronous integration
- Add retry and timeout behavior
- Show the warehouse fulfillment consumer
- Rename a service or change its responsibility
- Explain the purpose of a selected element
- Generate documentation for the diagram
- Drill into a container and create a more detailed diagram
This conversational workflow helps teams explore architecture iteratively. Instead of attempting to create a perfect diagram in one session, users can begin with a high-level description and progressively improve the model as their understanding develops.
Ask the AI to explain the diagram
Diagram generation is only one part of the experience. Users can also ask the AI Diagramming Chatbot to explain the generated diagram.
This is useful when a diagram needs to be reviewed by people with different levels of technical knowledge. An architect may want to examine integration patterns and system boundaries. A project manager may need a concise overview of the business flow. A developer may want to understand service responsibilities and data movement. A new team member may need a guided explanation of the architecture.
Users can ask questions such as:
- What is the purpose of this system landscape?
- Which systems are external to the enterprise boundary?
- What is the main order placement flow?
- Which integrations are synchronous?
- Where does asynchronous processing begin?
- What happens if payment authorization fails?
- Which components are involved in inventory reservation?
- What are the main architectural risks shown in this diagram?
- Generate a technical summary for this architecture.
- Explain this diagram to a non-technical stakeholder.
The result is a more interactive way to work with architecture diagrams. The diagram becomes a starting point for analysis, discussion, documentation, and decision-making rather than a static image created only for presentation.
Export diagrams as PNG, SVG, or copied images
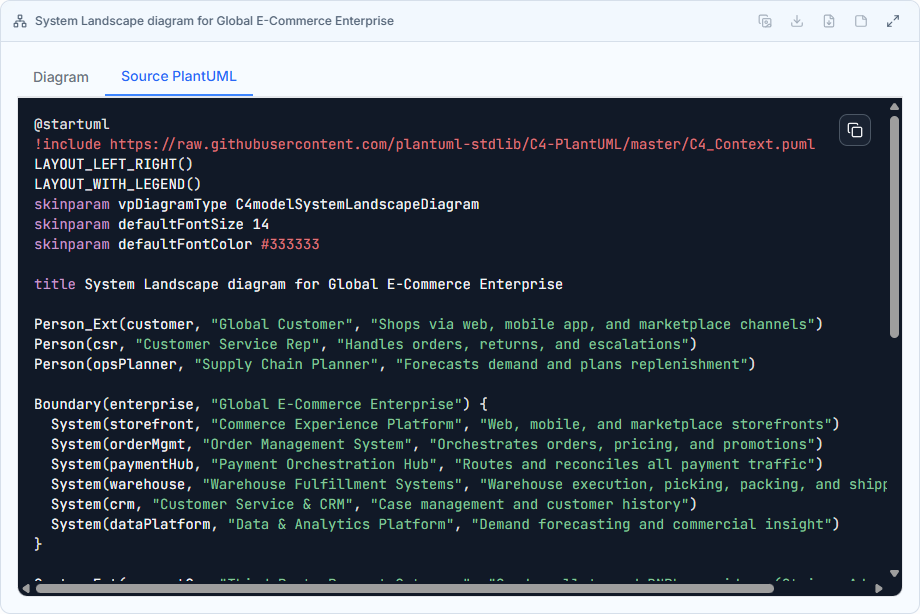
Once a diagram has been generated, users can view it directly in the chatbot interface. The diagram viewer provides a visual representation of the result, while the code viewer gives users access to the underlying diagram-as-code.
The code viewer uses a multi-tab interface, allowing users to switch between generated artifacts and inspect the code behind the diagrams. This is useful for users who want both the convenience of AI-generated visuals and the control of a text-based diagramming workflow.
Here is the diagram view:
Here is the code view that shows the C4 diagrams in PlantUML code:
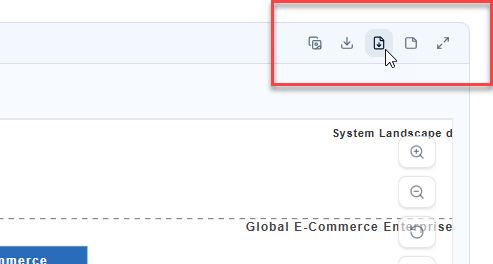
Users can export the generated diagram as:
- PNG for presentations, reports, emails, and general sharing
- SVG for scalable, high-quality documentation and publishing
- A copied image for quickly pasting the diagram into another application
Having both visual output and editable diagram code makes it easier to move from exploration to practical use. Teams can generate a first draft with AI, review the visual result, copy the code for further editing, or export the finished diagram for use in project materials.
Continue refining diagrams with Visual Paradigm VPasCode
AI-generated diagrams are an excellent way to accelerate the first draft, but architecture work often requires precise adjustments. Users can send the diagram-as-code output to Visual Paradigm VPasCode to touch up and refine the diagram using a code-centric workflow.
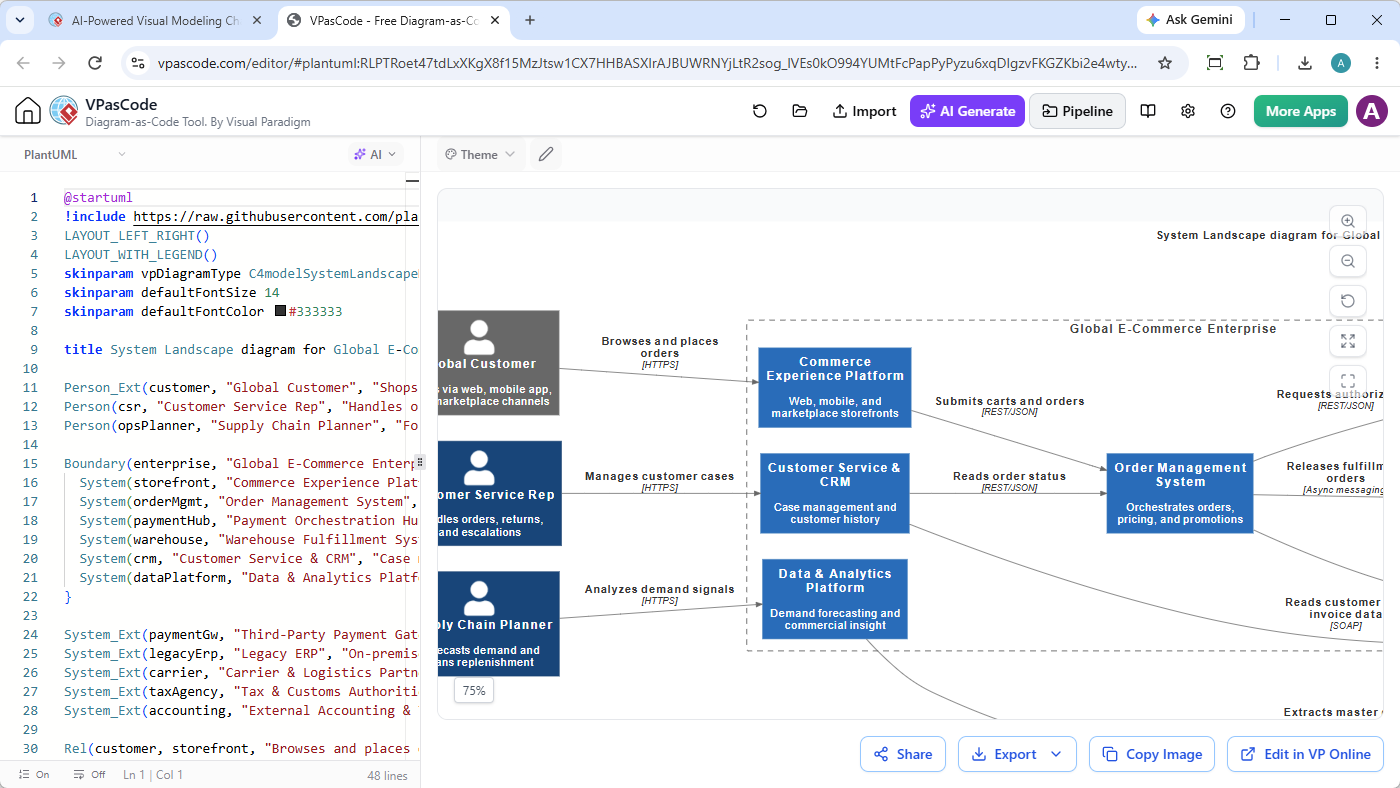
VPasCode is especially useful when users want to:
- Make precise changes to diagram syntax
- Adjust labels, relationships, layout, and styling
- Maintain diagrams as text-based artifacts
- Review the source code and rendered diagram together
- Continue working with PlantUML or other supported diagram-as-code formats
- Keep diagram changes easier to reproduce and maintain
This creates a natural workflow between AI-assisted architecture discovery and manual diagram-as-code refinement: describe the architecture, generate the first version, inspect the visual result, and then edit the source with greater precision.
Send diagrams to OpenDocs for living documentation
Architecture diagrams are most valuable when they remain connected to the documentation that explains them. Users can send generated diagrams to the Visual Paradigm Pipeline and insert them into pages in Visual Paradigm OpenDocs.
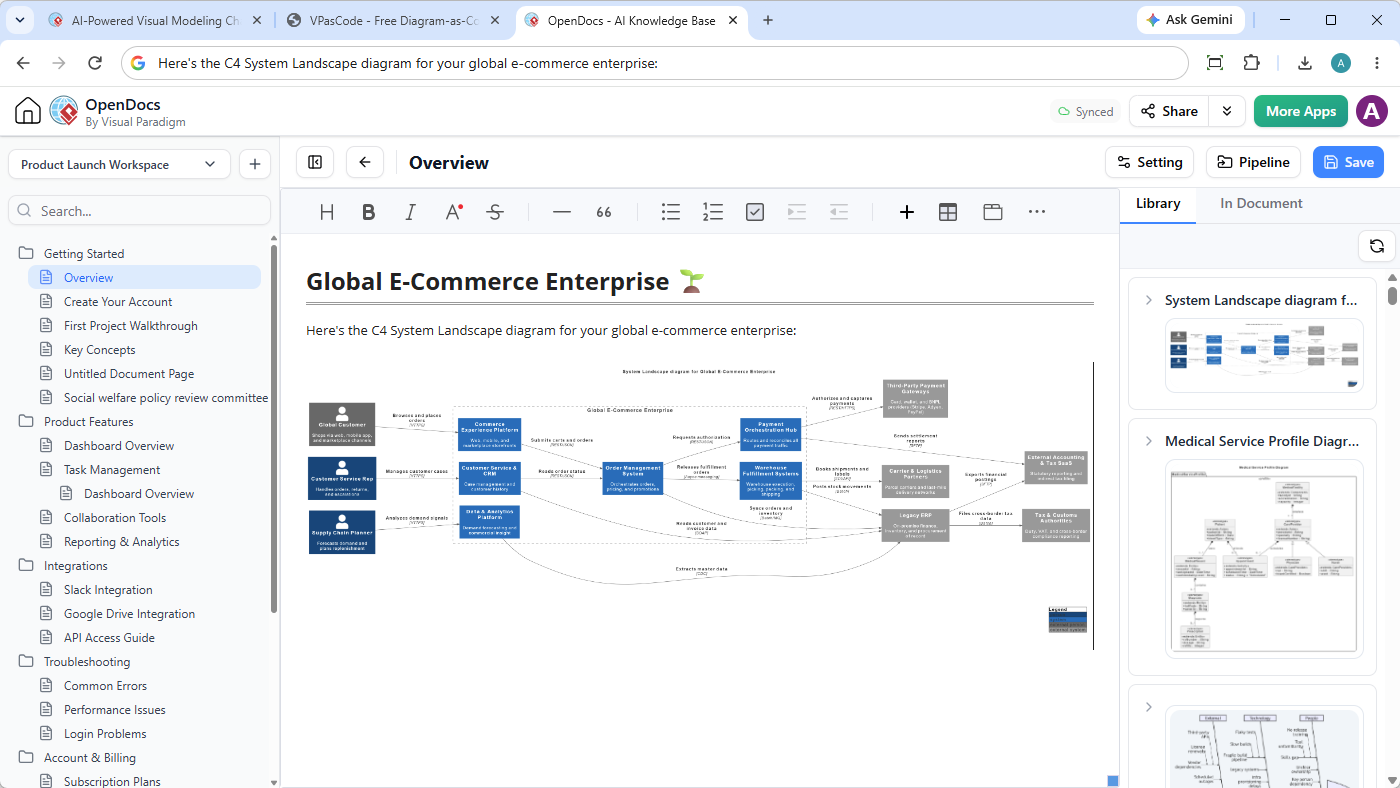
This makes it easier to create documentation that combines:
- Architecture diagrams
- System and service descriptions
- Business process explanations
- Integration details
- Architecture decisions
- Operational notes
- Technical procedures
- Project and delivery information
For example, a team could generate a C4 System Landscape Diagram for an e-commerce platform, send it to OpenDocs, and place it on an architecture overview page. A C4 Dynamic Diagram could then be inserted into an order processing page with an explanation of payment authorization, inventory reservation, event publication, and fulfillment hand-off.
This helps reduce the gap between creating a diagram and communicating its meaning. Instead of leaving the diagram in a chat session or exporting it as an isolated image, teams can incorporate it into a broader documentation structure.
Keep architecture conversations in Visual Paradigm NotesKeep
Architecture discussions often contain valuable decisions, explanations, assumptions, and follow-up ideas. The AI Diagramming Chatbot allows users to send a diagram, a complete reply, or selected phrases and paragraphs to Visual Paradigm NotesKeep.
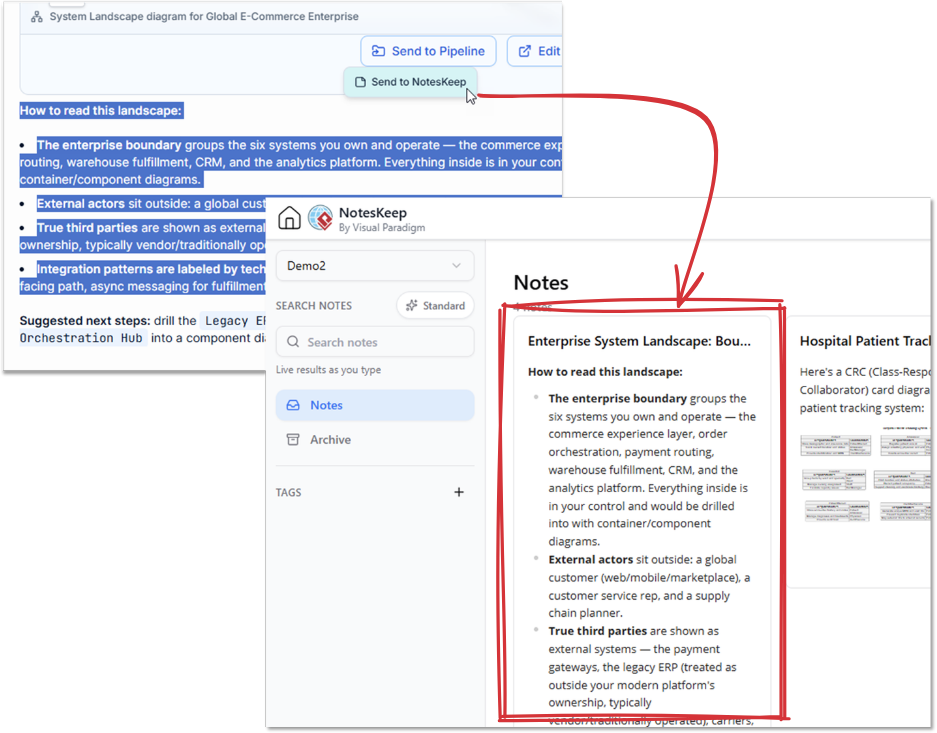
This is useful for preserving:
- Architecture rationale
- Design assumptions
- Integration decisions
- Questions raised during review
- Explanations of complex diagrams
- Potential failure and compensation flows
- Future improvements and modernization opportunities
- Important excerpts from AI-generated technical discussions
For instance, after generating the e-commerce architecture example, a team could save the explanation of the legacy ERP integration as a note, preserve the proposed payment failure path, or record the decision to use an asynchronous event for fulfillment hand-off.
By connecting AI-generated diagrams with notes and documentation, the workflow supports not only visual creation but also knowledge capture and long-term collaboration.
Useful scenarios for the AI C4 Diagram generator
The new C4 diagram capabilities can support a wide range of architecture and engineering activities.
Enterprise architecture discovery
Use a C4 System Landscape Diagram to map business systems, external services, users, departments, and integration dependencies. This provides a common starting point for architecture workshops and system inventory reviews.
Application modernization
Visualize the relationship between modern services, legacy platforms, databases, batch jobs, and third-party systems. The resulting diagram can help teams identify migration boundaries, integration risks, and opportunities for incremental modernization.
API and integration planning
Use a C4 Dynamic Diagram to explain the sequence of API calls, events, database updates, and external service interactions involved in a business transaction.
Technical onboarding
Give new team members a landscape view of the organization’s systems and a scenario-based explanation of how important workflows operate.
Architecture reviews
Generate an initial diagram before a review meeting, then use follow-up prompts to add missing dependencies, clarify boundaries, and explore failure paths.
Requirements analysis
Transform informal requirements into visual architecture models that can be reviewed by product owners, analysts, architects, and development teams.
Documentation and knowledge sharing
Generate diagrams and explanations together, then send the results to OpenDocs or NotesKeep for continued use across the project lifecycle.
How to write effective prompts for C4 diagrams
The AI C4 Diagram tool can work from natural-language descriptions, but prompts become more useful when they identify the scope, actors, systems, relationships, and desired level of detail.
A strong prompt can include:
- The diagram type, such as C4 System Landscape or C4 Dynamic
- The business domain or system being modeled
- The people, roles, or external actors involved
- The internal systems, containers, or services to include
- Third-party systems and legacy platforms
- The main relationships and data flows
- The scenario or workflow to illustrate
- Relevant technologies or communication protocols
- The audience for the diagram
For a System Landscape Diagram, try a prompt such as:
Generate a C4 System Landscape diagram for a healthcare organization. Include patients, clinicians, administrators, the patient portal, electronic medical records, laboratory systems, pharmacy systems, insurance providers, identity services, and external reporting authorities. Show the main interactions and distinguish systems operated by the organization from external systems.
For a Dynamic Diagram, try a prompt such as:
Generate a C4 Dynamic diagram for a food delivery platform showing how a customer places an order. Include the mobile app, API Gateway, order service, restaurant service, payment service, delivery dispatch service, database, and event bus. Show the sequence from order submission through payment authorization, restaurant acceptance, courier assignment, and customer confirmation.
Users can then refine the result with additional instructions, such as asking the AI to add error handling, show asynchronous events, include a legacy integration, or explain the responsibilities of a selected service.
From architecture idea to reusable project artifact
The main benefit of this enhancement is not simply that the AI can draw two more diagram types. The larger benefit is that users can follow a more complete architecture workflow inside the Visual Paradigm ecosystem.
- Describe an architecture or business scenario in natural language.
- Generate a C4 System Landscape Diagram or C4 Dynamic Diagram.
- Ask the AI to explain, refine, or expand the diagram.
- Review the visual output and inspect the underlying diagram code.
- Export the diagram as PNG or SVG, or copy it as an image.
- Touch up the diagram-as-code in VPasCode.
- Send the diagram to OpenDocs for structured documentation.
- Save the conversation, diagram, or selected explanation in NotesKeep.
This workflow reduces context switching and helps teams preserve the connection between requirements, diagrams, explanations, source code, and documentation.
Try the enhanced AI C4 Diagram generator
The addition of C4 System Landscape and C4 Dynamic Diagram support gives users more ways to explore and communicate software architecture with AI.
Use a System Landscape Diagram when you need to understand the complete environment around an enterprise or platform. Use a Dynamic Diagram when you need to explain the interactions involved in a specific use case. Combine them with C4 Context, Container, Component, and Deployment diagrams to create a more complete, multi-level view of your architecture.
Whether you are planning a new platform, analyzing legacy integration, documenting APIs, reviewing a business workflow, or onboarding a development team, the AI C4 Diagram tool can help you move from an idea to a meaningful visual model faster.
Start creating C4 diagrams with AI
To see the new capability in action, explore the shared C4 e-commerce architecture conversation.
Related posts:
 Major Upgrade to AI UML Component Diagram Generation in Visual Paradigm AI Chatbot
 Important Update: AI-Powered Features Now Require Active Software Maintenance
 Enhance Your Workflow: Generate and Visualize Structured JSON with Visual Paradigm AI Chatbot
 AI Data Generator Update: Generate SQL, JSON, XML, CSV & More with AI Diagramming Chatbot