


At Visual Paradigm, we are constantly pushing the boundaries of how developers, data analysts, and tech professionals visualize complex systems and datasets. Recently, we introduced Visual Paradigm VPasCode, a unified text-to-diagram platform designed to eliminate the friction of shifting between multiple drawing tools. By supporting popular syntax options like Mermaid, PlantUML, and Graphviz within a single, integrated developer environment, VPasCode has quickly become a go-to ecosystem for quick, precise diagram rendering.
Today, we are thrilled to announce a major enhancement to our toolkit: VPasCode now natively supports Apache ECharts. This addition morphs our diagramming environment into a highly flexible, code-driven chart maker. You can now transform your JSON configurations or AI-assisted descriptions into rich, interactive data visualizations in real time.
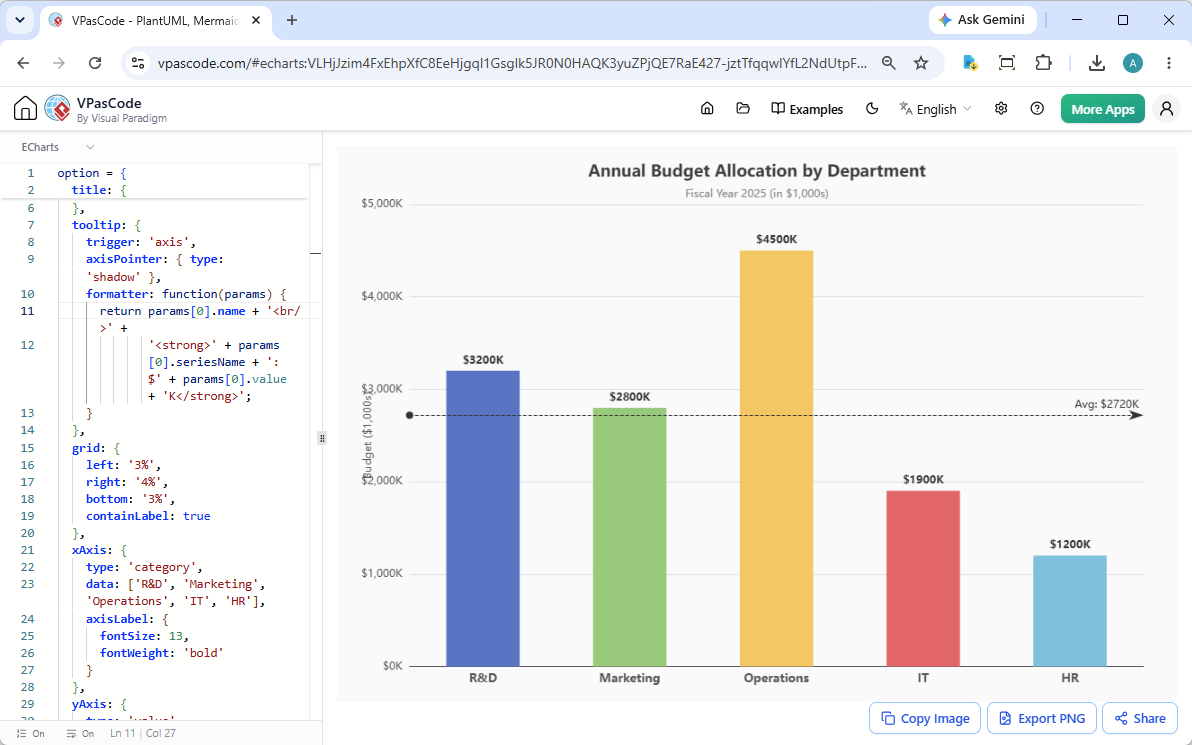
With our side-by-side interface, the mechanics remain simple and intuitive: input your ECharts configuration object on the left panel, and your interactive dashboard components render seamlessly on the right panel.
Why Choose VPasCode as Your Chart Generator?
While standard static charting software forces you to drag, drop, and manually adjust individual pixels, VPasCode relies completely on structured code. Integrating ECharts unlocks distinct advantages for modern technical teams:
- Unified Architecture: Switch effortlessly between application architecture blueprints (via PlantUML/Mermaid) and data analytics dashboards (via ECharts) within the same tab.
- AI-Driven Workflows: Leverage our platform as an intelligent AI chart generator. Describe your data requirements natively (in our AI Diagramming Chatbot), and see accurate visualizations built automatically without manual styling.
- Highly Sharable States: Every diagram configuration is compressed into a unique, shareable URL, making it incredibly easy to collaborate on code reviews, wiki documentation, or live client presentations.
Exploring Live Examples of ECharts in VPasCode
To demonstrate the performance of our updated chart generator, we have prepared several production-grade data visualization templates. You can interact with each sample directly by visiting the accompanying playground links.
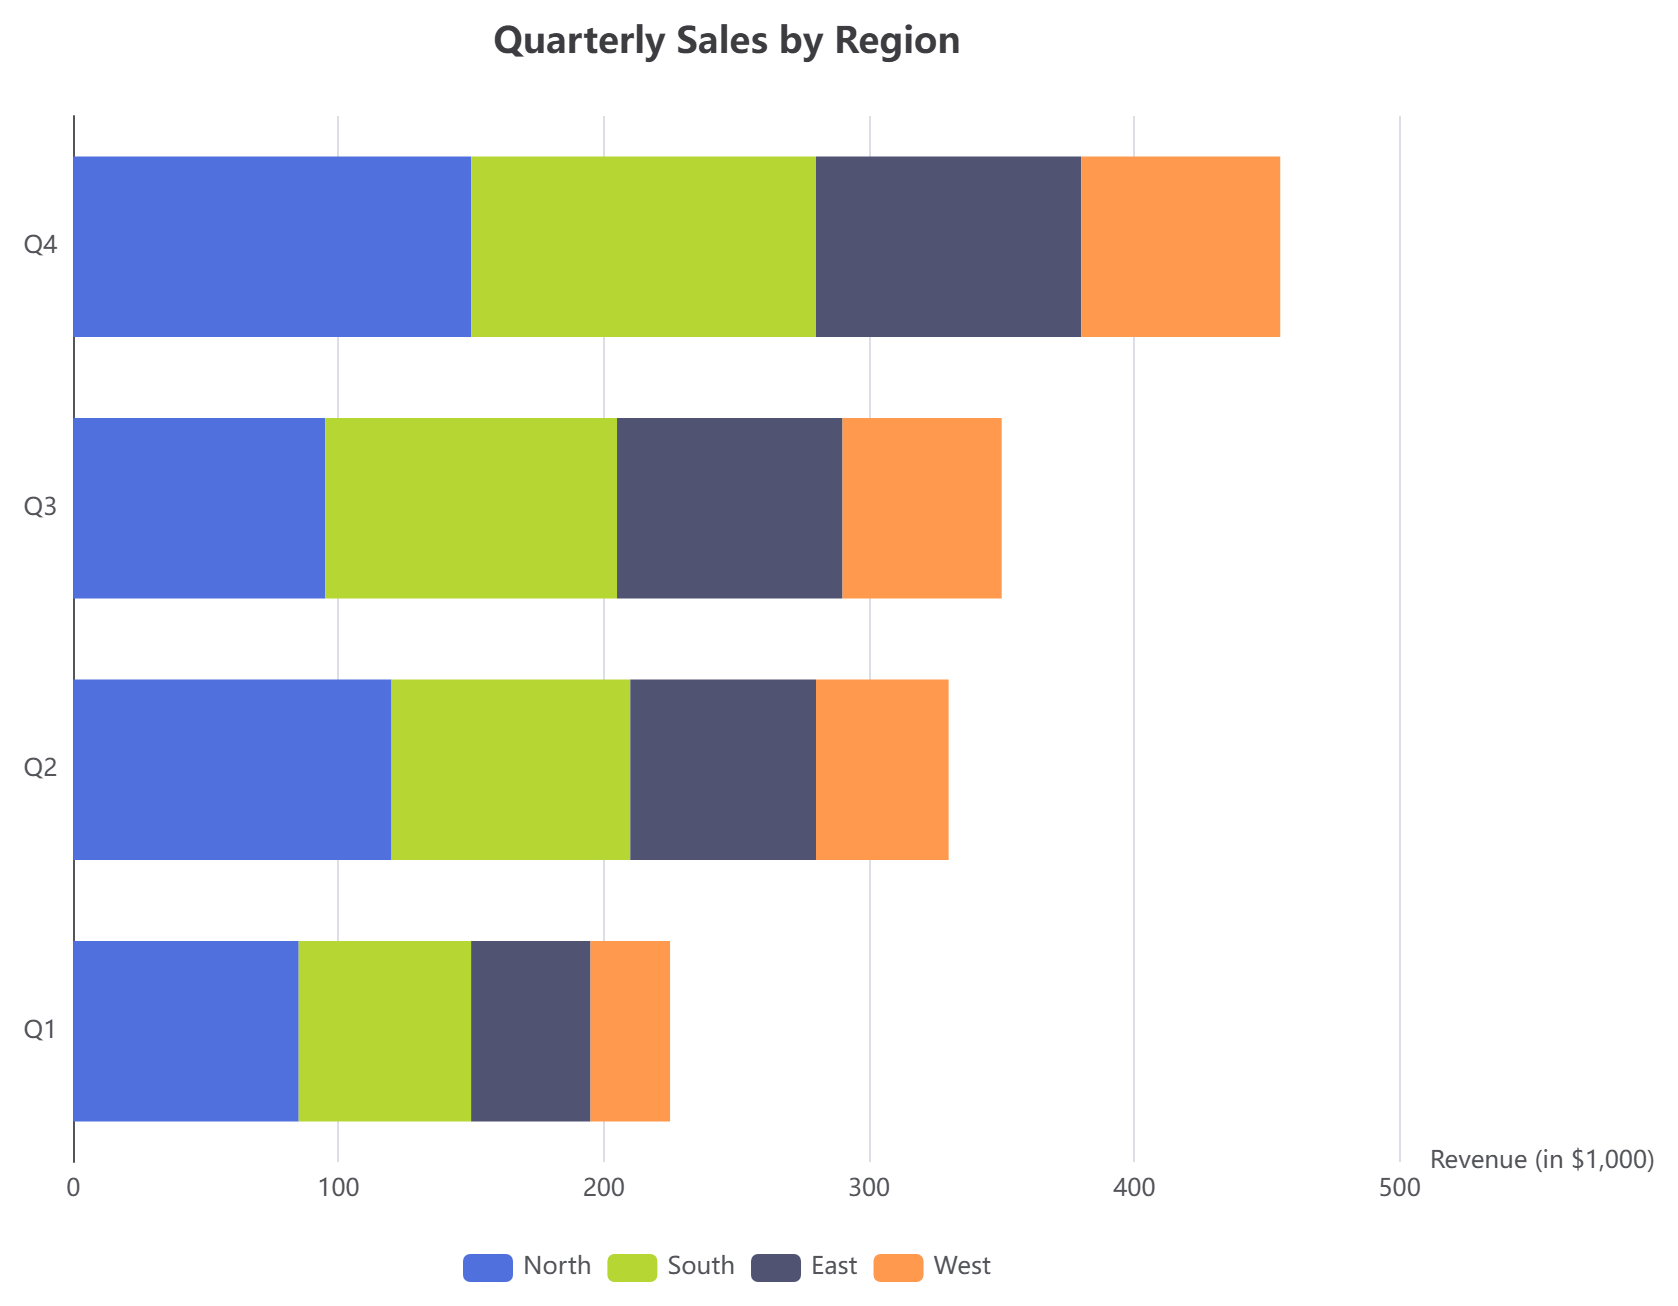
1. Stacked Bar Chart (Regional Sales Analysis)
Perfect for looking at absolute totals across groups while breaking down categorical distributions simultaneously.
option = {
  title: { text: 'Quarterly Sales by Region' },
  tooltip: { trigger: 'axis', axisPointer: { type: 'shadow' } },
  legend: { data: ['North', 'South', 'East', 'West'] },
  xAxis: { type: 'value', name: 'Revenue (in $1,000)' },
  yAxis: { type: 'category', data: ['Q1', 'Q2', 'Q3', 'Q4'] },
  series: [
    { name: 'North', type: 'bar', stack: 'Total', data: [85, 120, 95, 150] },
    { name: 'South', type: 'bar', stack: 'Total', data: [65, 90, 110, 130] },
    { name: 'East',  type: 'bar', stack: 'Total', data: [45, 70, 85, 100] },
    { name: 'West',  type: 'bar', stack: 'Total', data: [30, 50, 60, 75] }
  ]
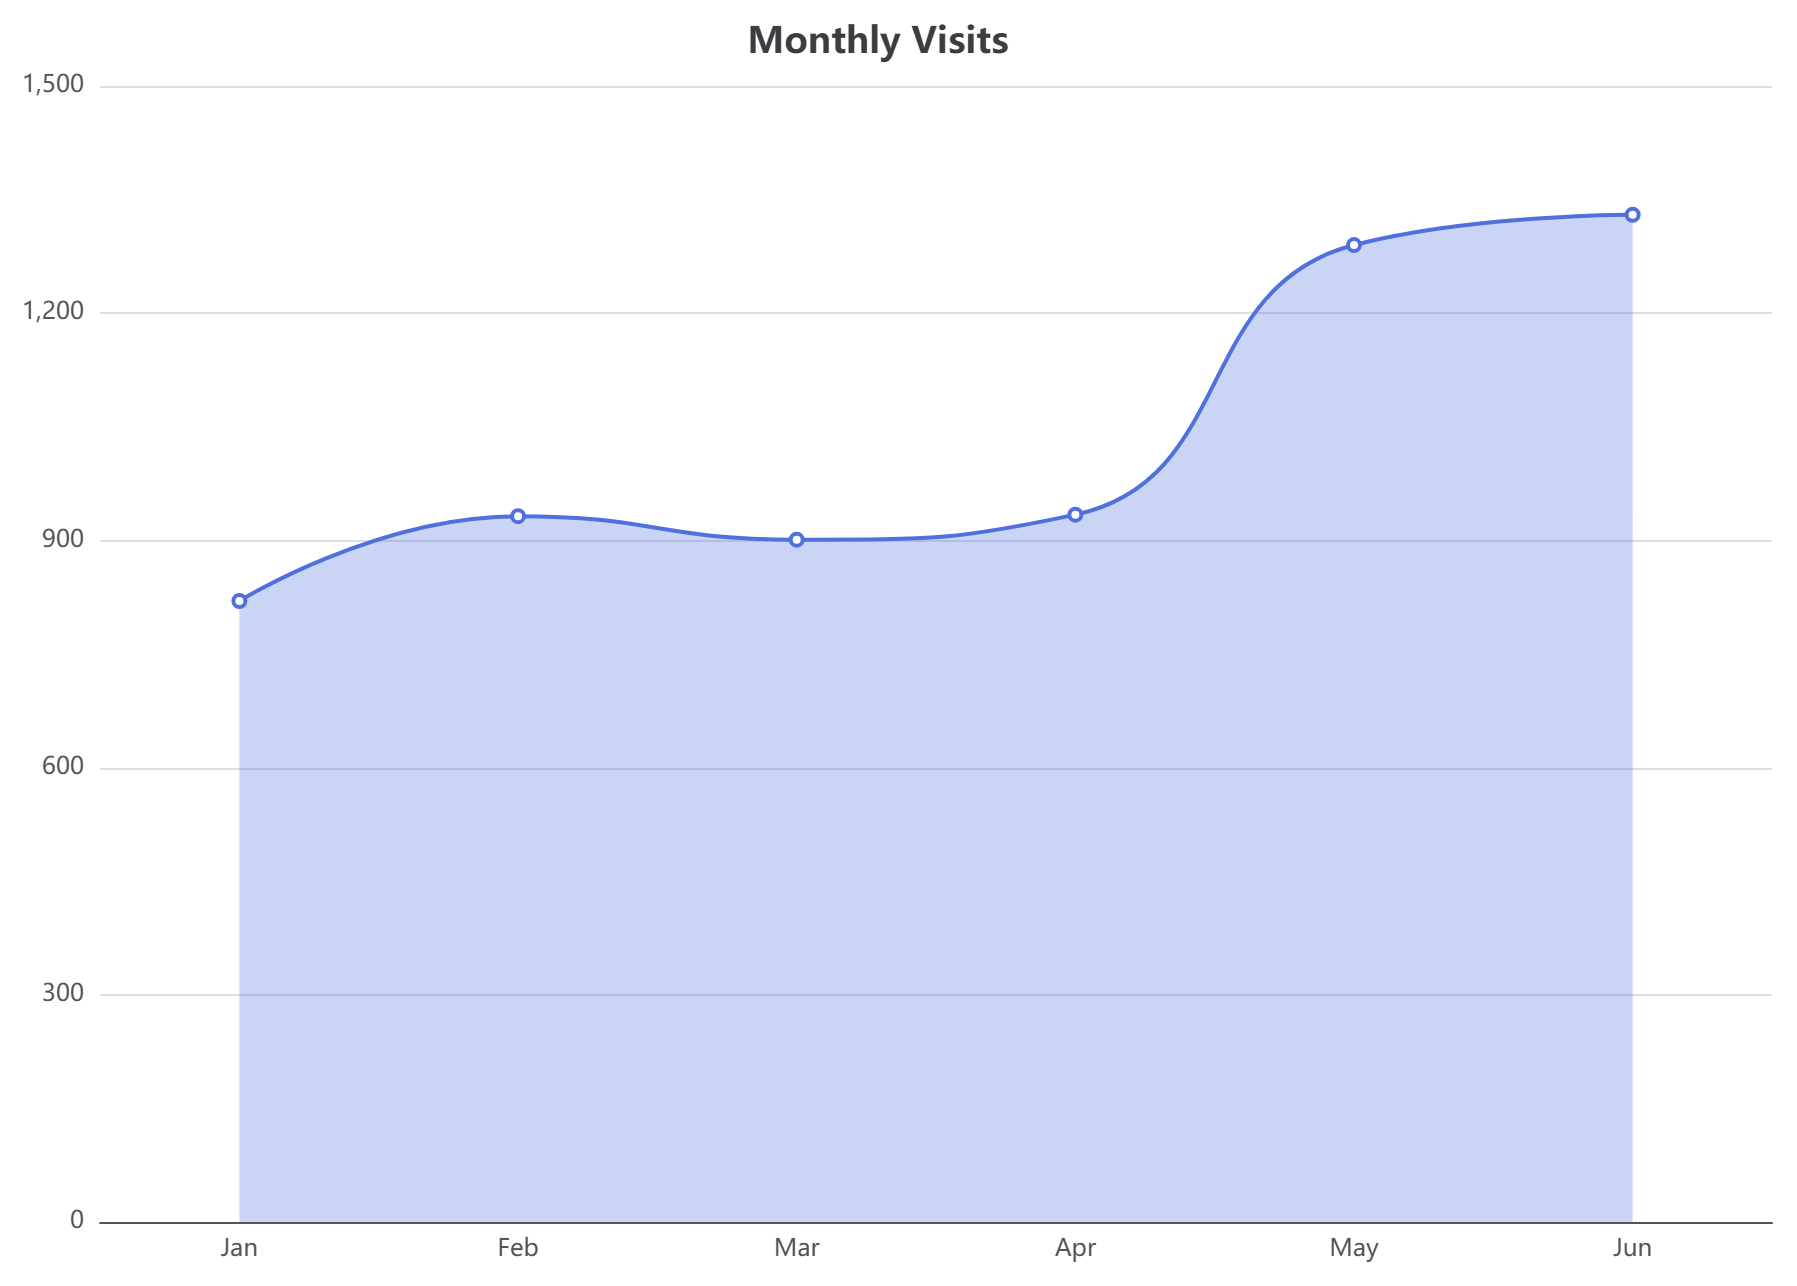
};2. Line Chart with Shaded Area (Monthly Website Growth)
Designed for tracking chronological shifts with smooth interpolations and clean grid alignments.
option = {
  title: { text: 'Monthly Visits', left: 'center' },
  tooltip: { trigger: 'axis' },
  grid: { left: 40, right: 20, top: 50, bottom: 30, containLabel: true },
  xAxis: { type: 'category', data: ['Jan','Feb','Mar','Apr','May','Jun'] },
  yAxis: { type: 'value' },
  series: [{
    name: 'Visits',
    type: 'line',
    smooth: true,
    data: [820, 932, 901, 934, 1290, 1330],
    areaStyle: { opacity: 0.3 }
  }]
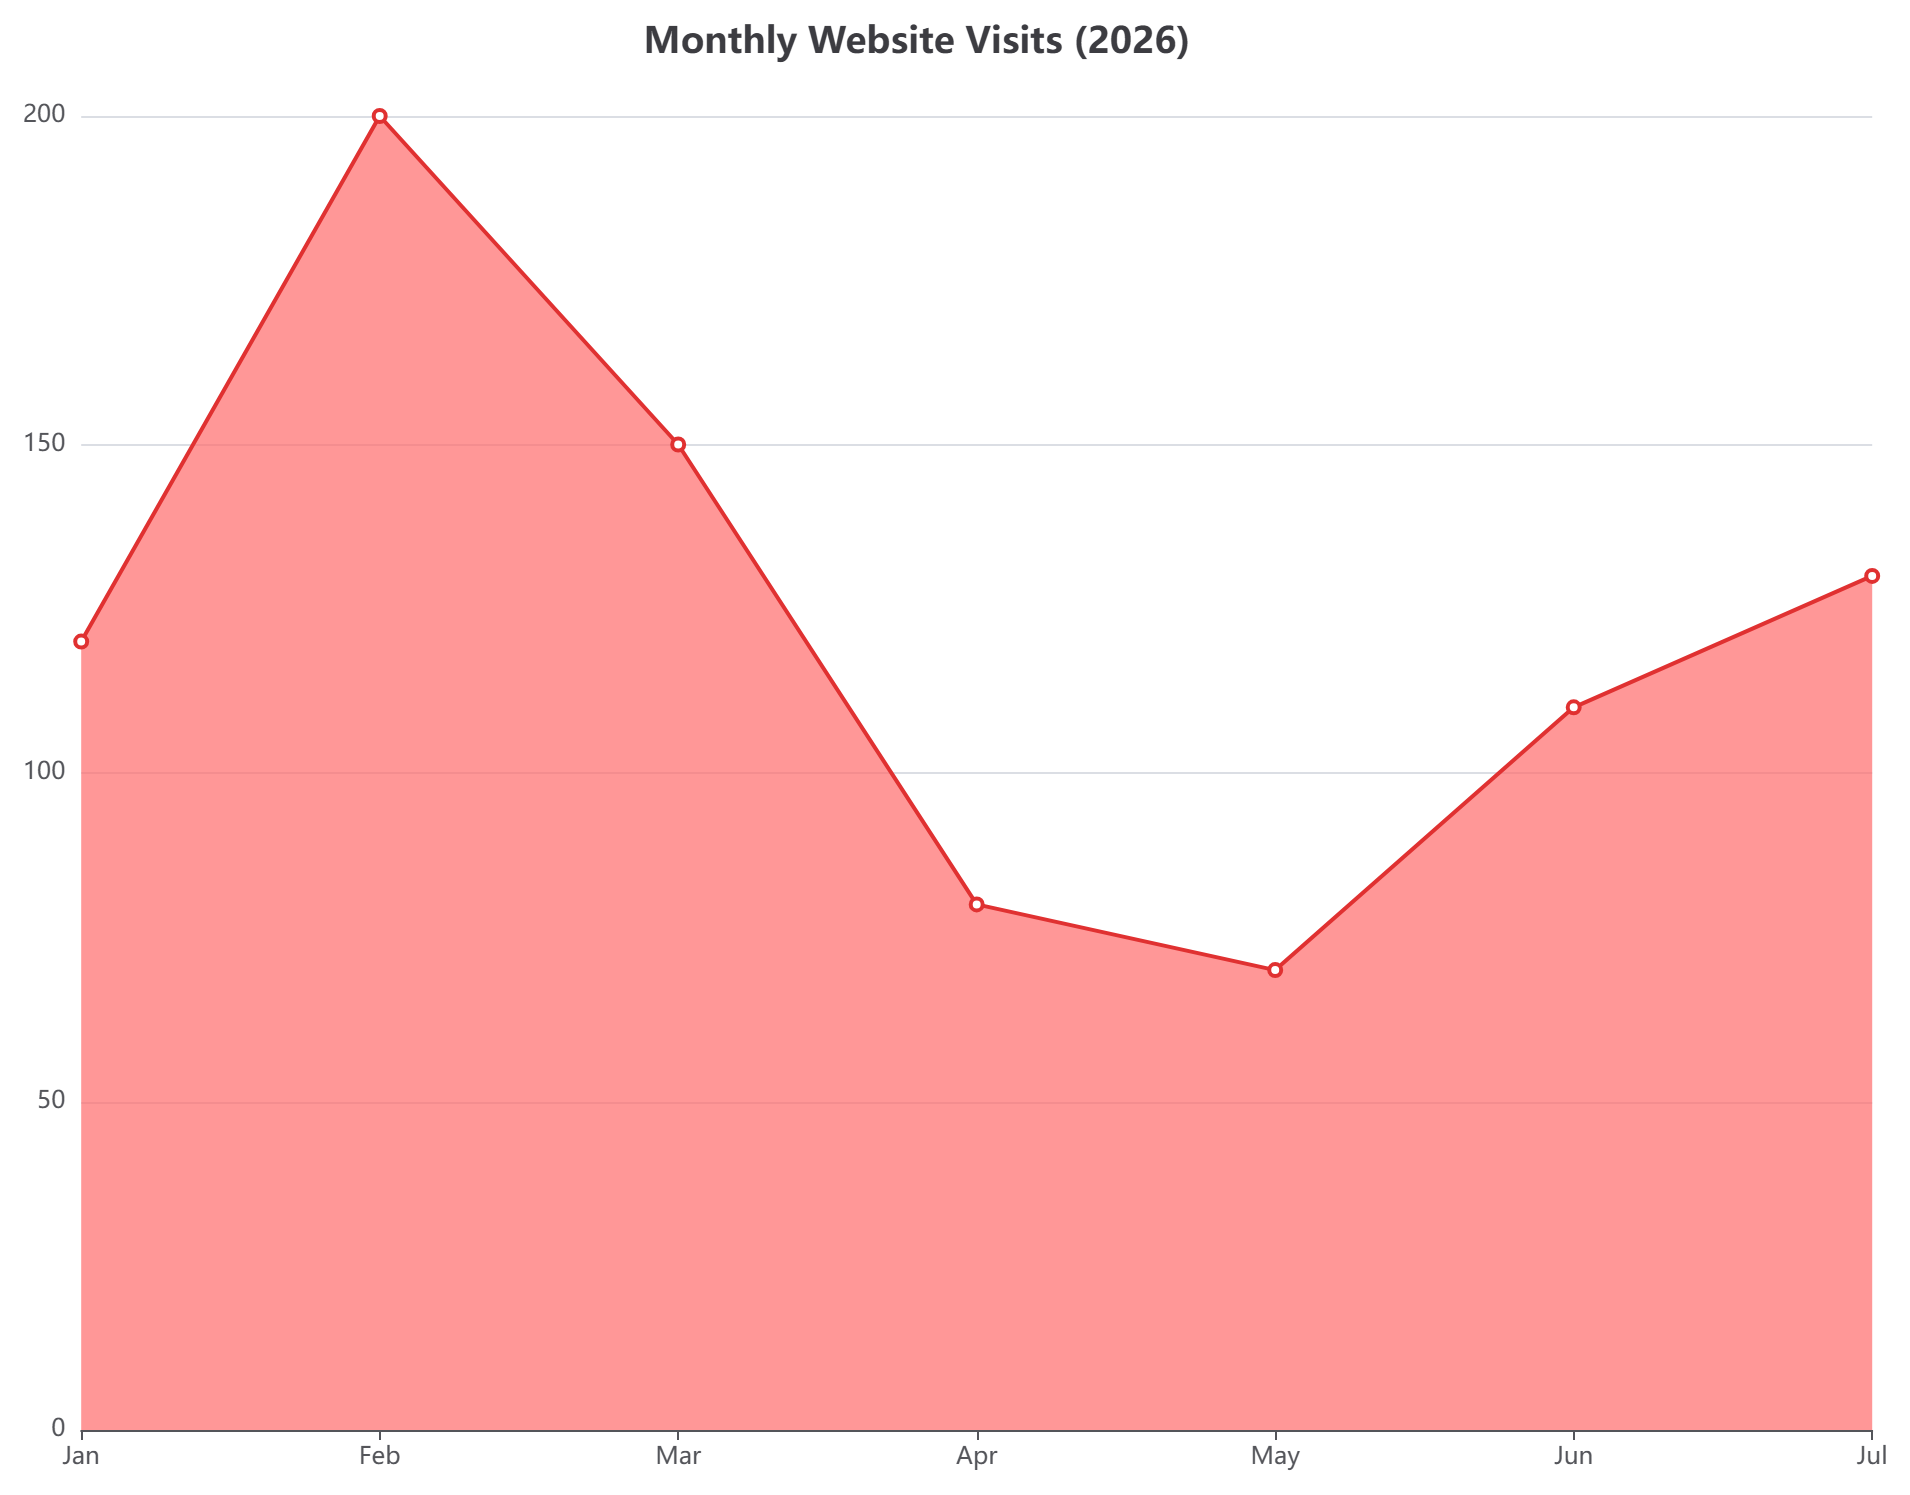
};3. Custom Area Chart (Bright Highlights)
An excellent showcase of styling flexibilities where line colors, boundary configurations, and filling opacity can be manipulated instantly.
option = {
  title: { text: 'Monthly Website Visits (2026)' },
  xAxis: { type: 'category', boundaryGap: false, data: ['Jan', 'Feb', 'Mar', 'Apr', 'May', 'Jun', 'Jul'] },
  yAxis: { type: 'value' },
  series: [{
    data: [120, 200, 150, 80, 70, 110, 130],
    type: 'line',
    areaStyle: { color: '#ff6b6b' },
    lineStyle: { color: '#e03131' },
    itemStyle: { color: '#e03131' }
  }]
};4. Interactive Pie Chart (Traffic Referral Mix)
A classic layout for computing relative market share or traffic sources, complete with a clean bottom legend container.
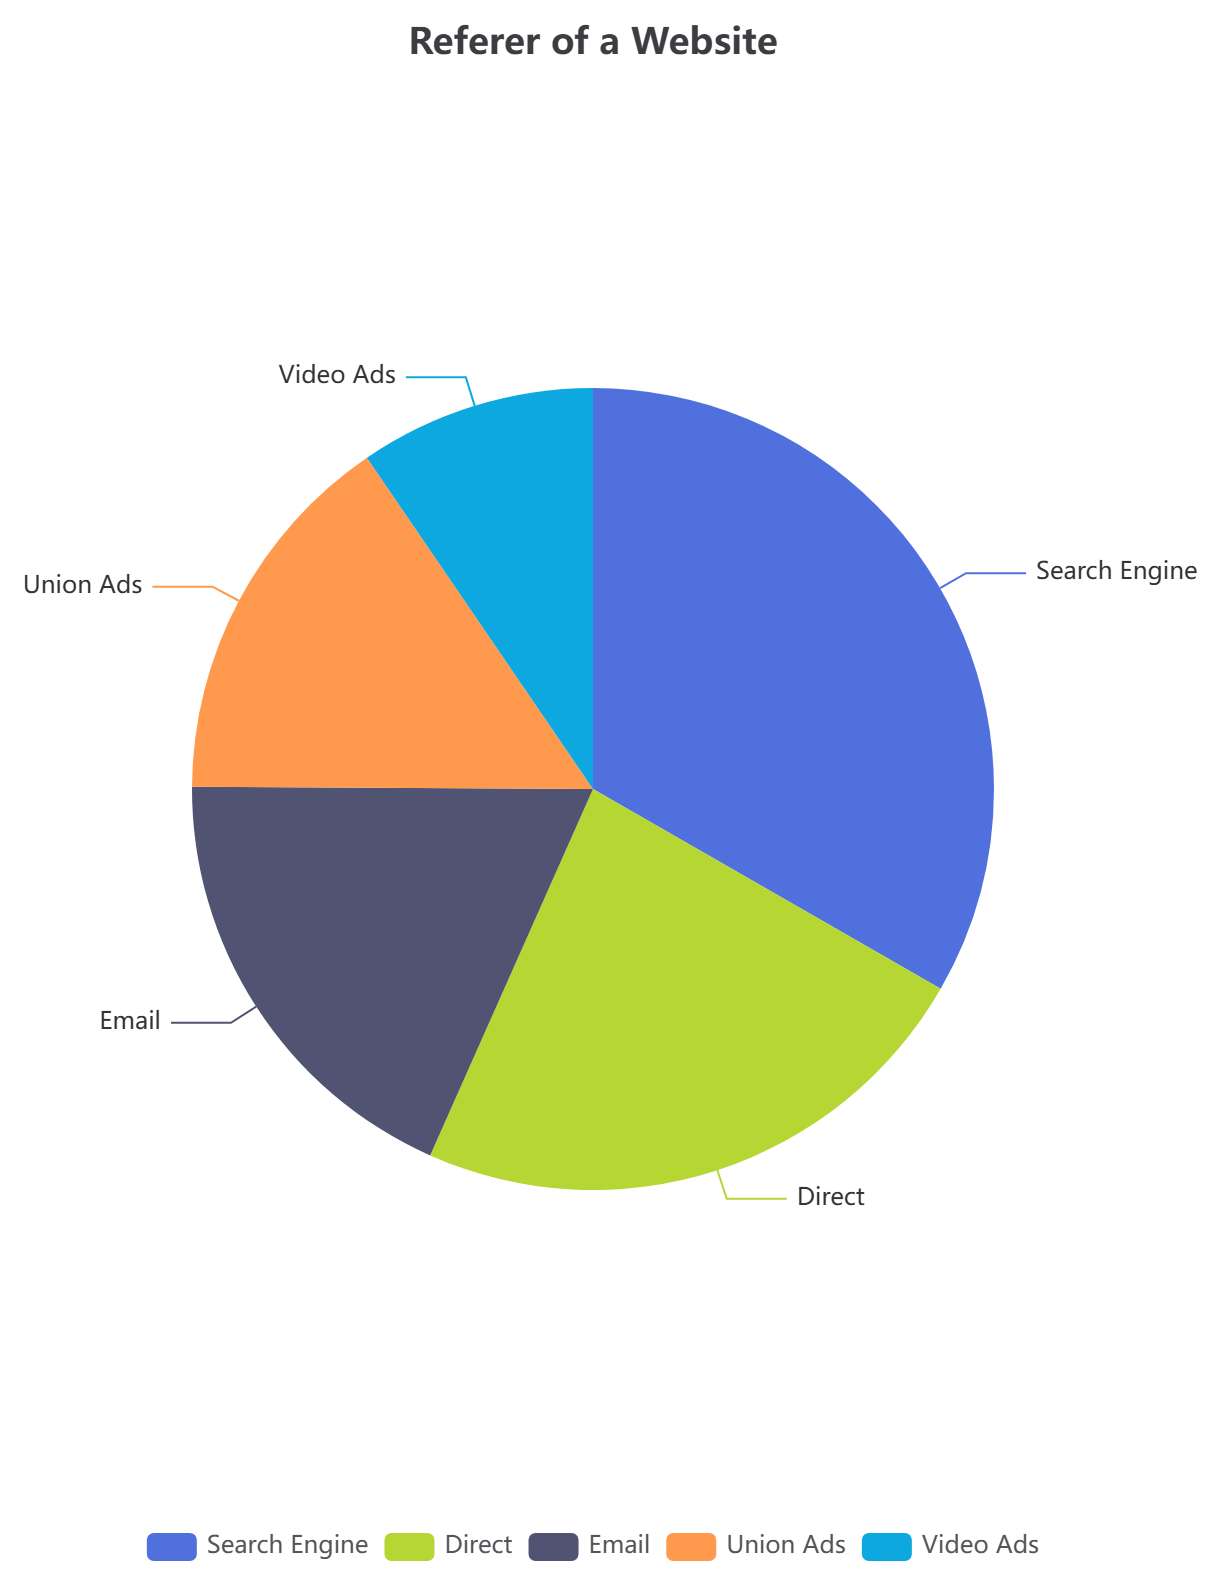
option = {
  title: { text: 'Referer of a Website', left: 'center' },
  tooltip: { trigger: 'item' },
  legend: { bottom: 10 },
  series: [
    {
      name: 'Access From',
      type: 'pie',
      radius: '50%',
      data: [
        { value: 1048, name: 'Search Engine' },
        { value: 735, name: 'Direct' },
        { value: 580, name: 'Email' },
        { value: 484, name: 'Union Ads' },
        { value: 300, name: 'Video Ads' }
      ]
    }
  ]
};5. Radar Chart (Service Mesh Architecture Comparison)
A multivariate graph structure often used to evaluate technical capabilities, software benchmarks, or complex architecture criteria side-by-side.
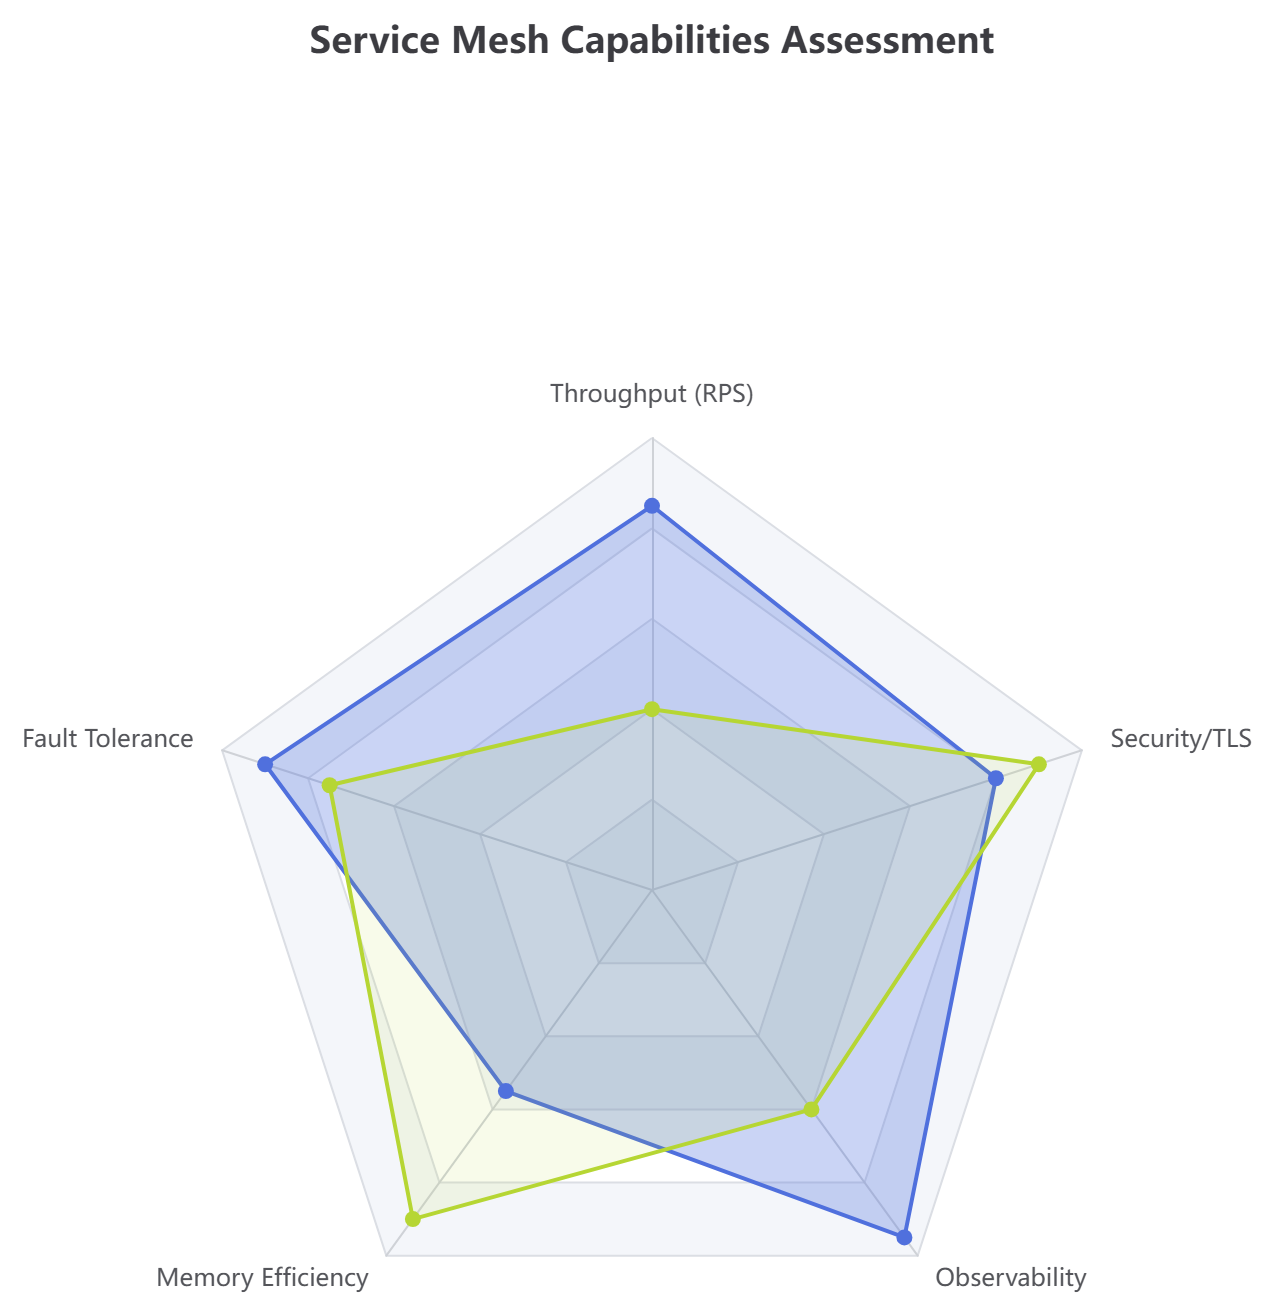
option = {
  title: { text: 'Service Mesh Capabilities Assessment' },
  tooltip: {},
  radar: {
    indicator: [
      { name: 'Throughput (RPS)', max: 100 },
      { name: 'Fault Tolerance', max: 100 },
      { name: 'Memory Efficiency', max: 100 },
      { name: 'Observability', max: 100 },
      { name: 'Security/TLS', max: 100 }
    ]
  },
  series: [{
    name: 'Service Profiles',
    type: 'radar',
    data: [
      { value: [85, 90, 55, 95, 80], name: 'Go Proxy Node', areaStyle: { opacity: 0.3 } },
      { value: [40, 75, 90, 60, 90], name: 'Legacy Java Gateway', areaStyle: { opacity: 0.1 } }
    ]
  }]
};6. Scatter Plot (Inference Latency Metric Profile)
Great for identifying outlier spikes, payload sizing thresholds, and application bottlenecks across distributed infrastructures.
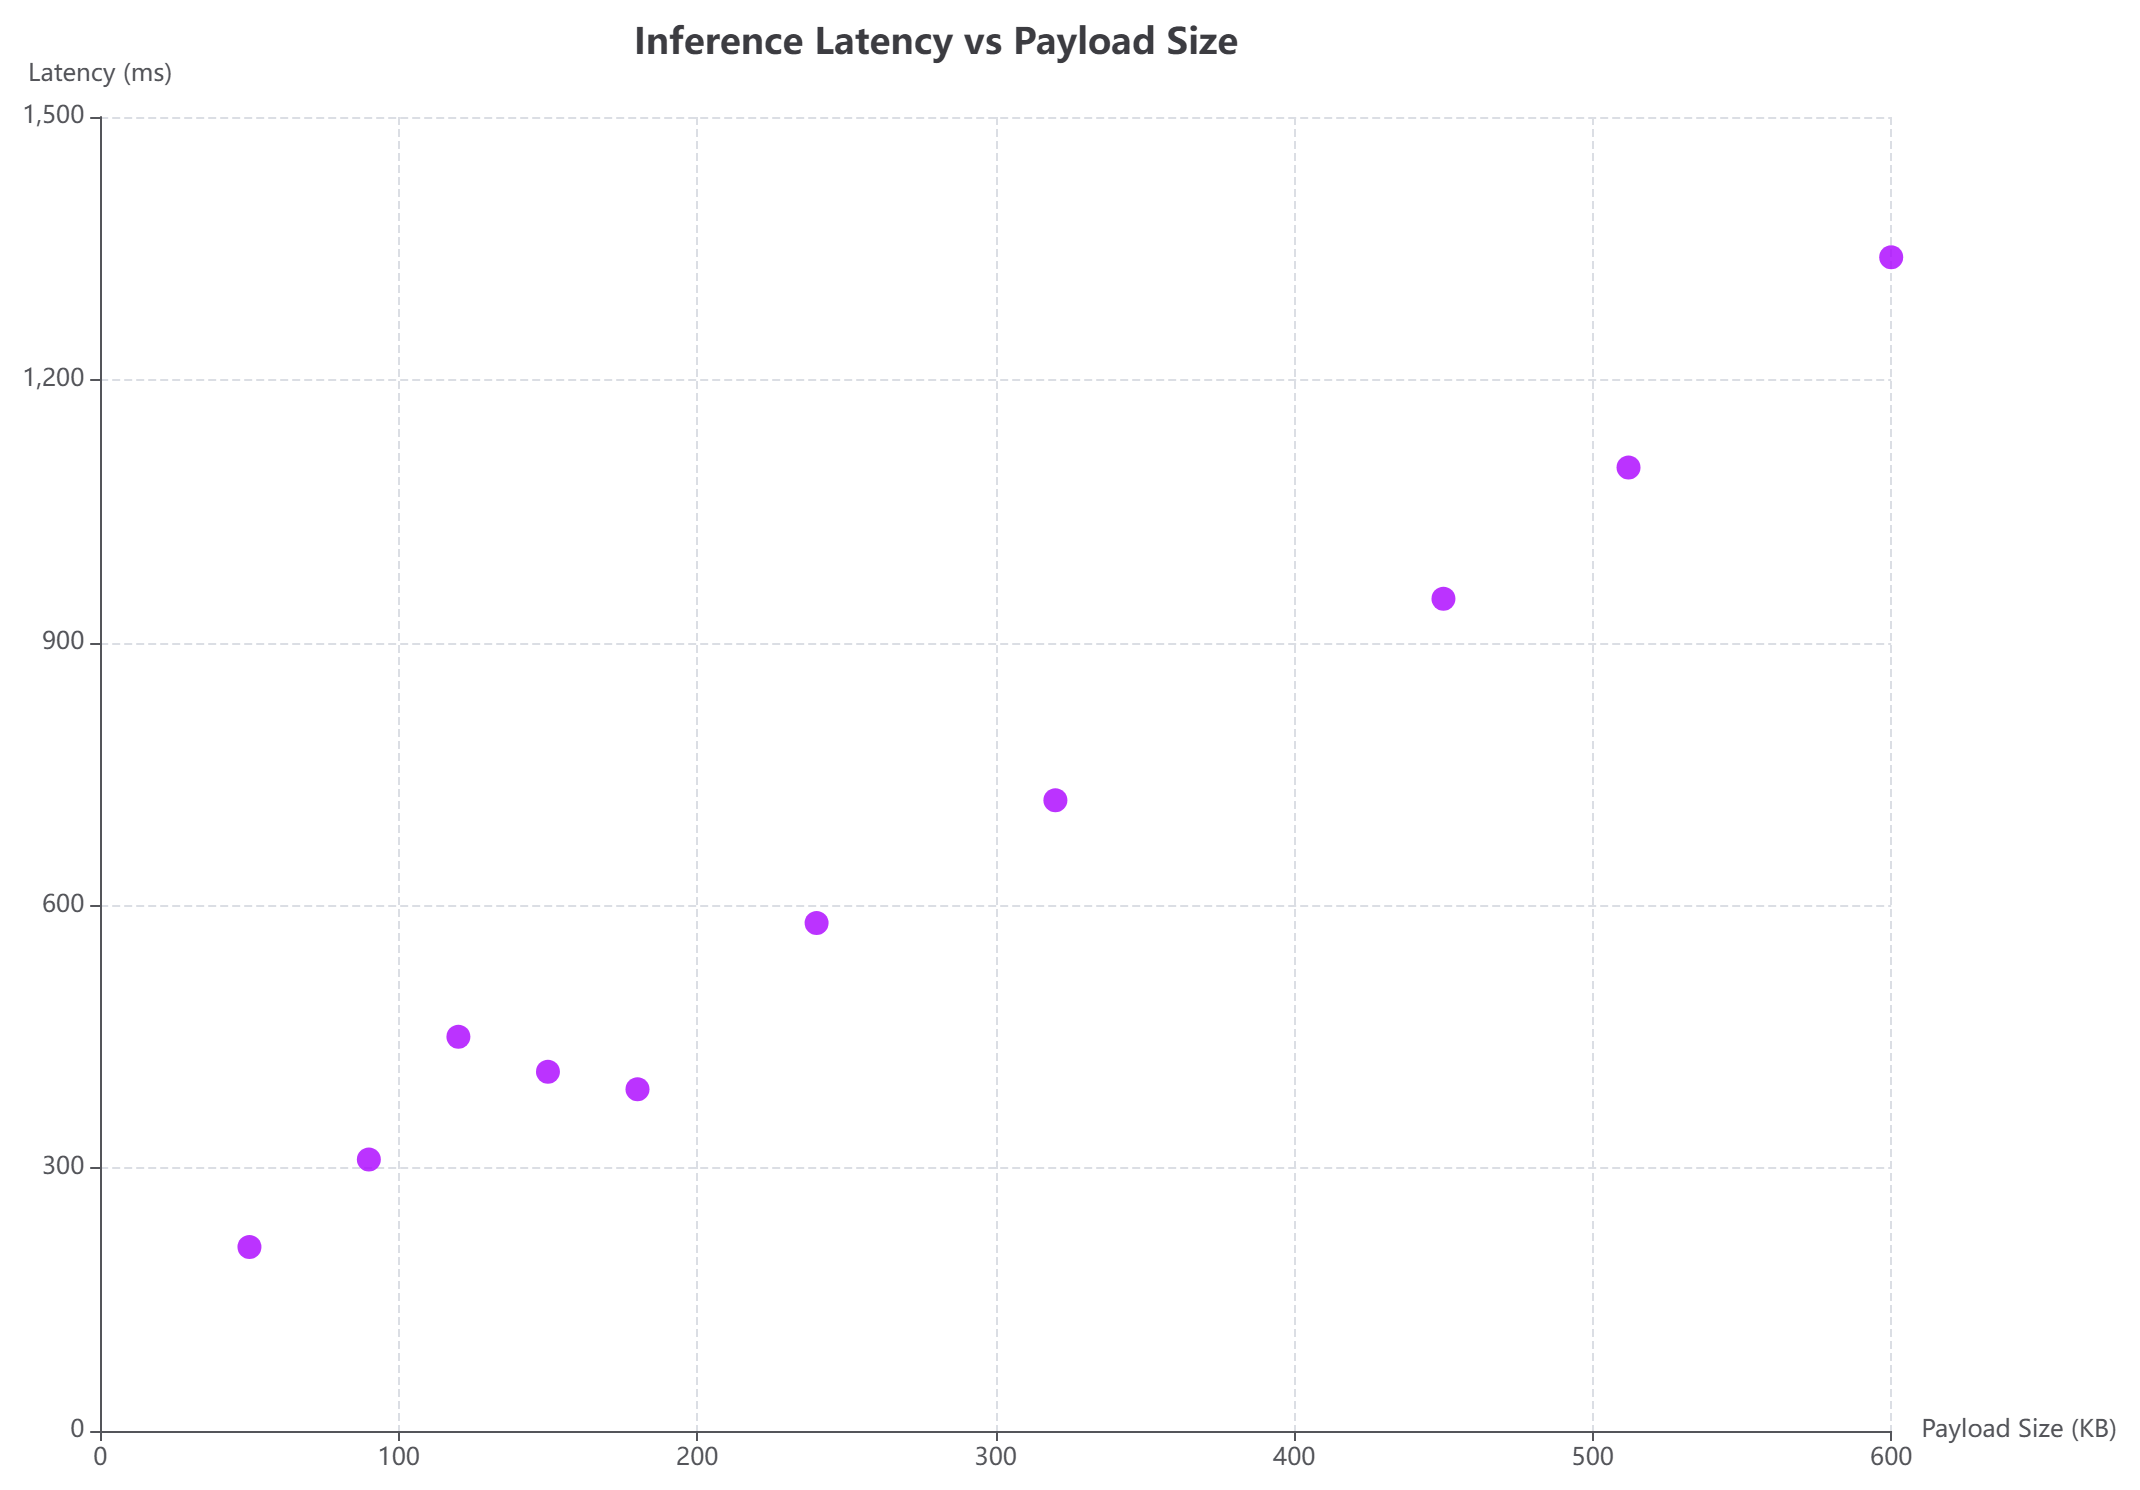
option = {
  title: { text: 'Inference Latency vs Payload Size', left: 'center' },
  tooltip: { trigger: 'item', formatter: function (p) { return 'Size: ' + p.value[0] + ' KB<br />Latency: ' + p.value[1] + ' ms'; } },
  xAxis: { name: 'Payload Size (KB)', type: 'value', splitLine: { lineStyle: { type: 'dashed' } } },
  yAxis: { name: 'Latency (ms)', type: 'value', splitLine: { lineStyle: { type: 'dashed' } } },
  series: [{
    type: 'scatter',
    symbolSize: 12,
    data: [
      [120, 450], [240, 580], [50, 210], [512, 1100], [320, 720],
      [180, 390], [450, 950], [90, 310], [600, 1340], [150, 410]
    ],
    itemStyle: { color: '#aa00ff' }
  }]
};7. Sunburst Chart (Multi-Level Codebase Licensing)
Visualize hierarchical relationships with concentric rings. Our platform acts as an organic chart maker to simplify complex nested data configurations like this one.
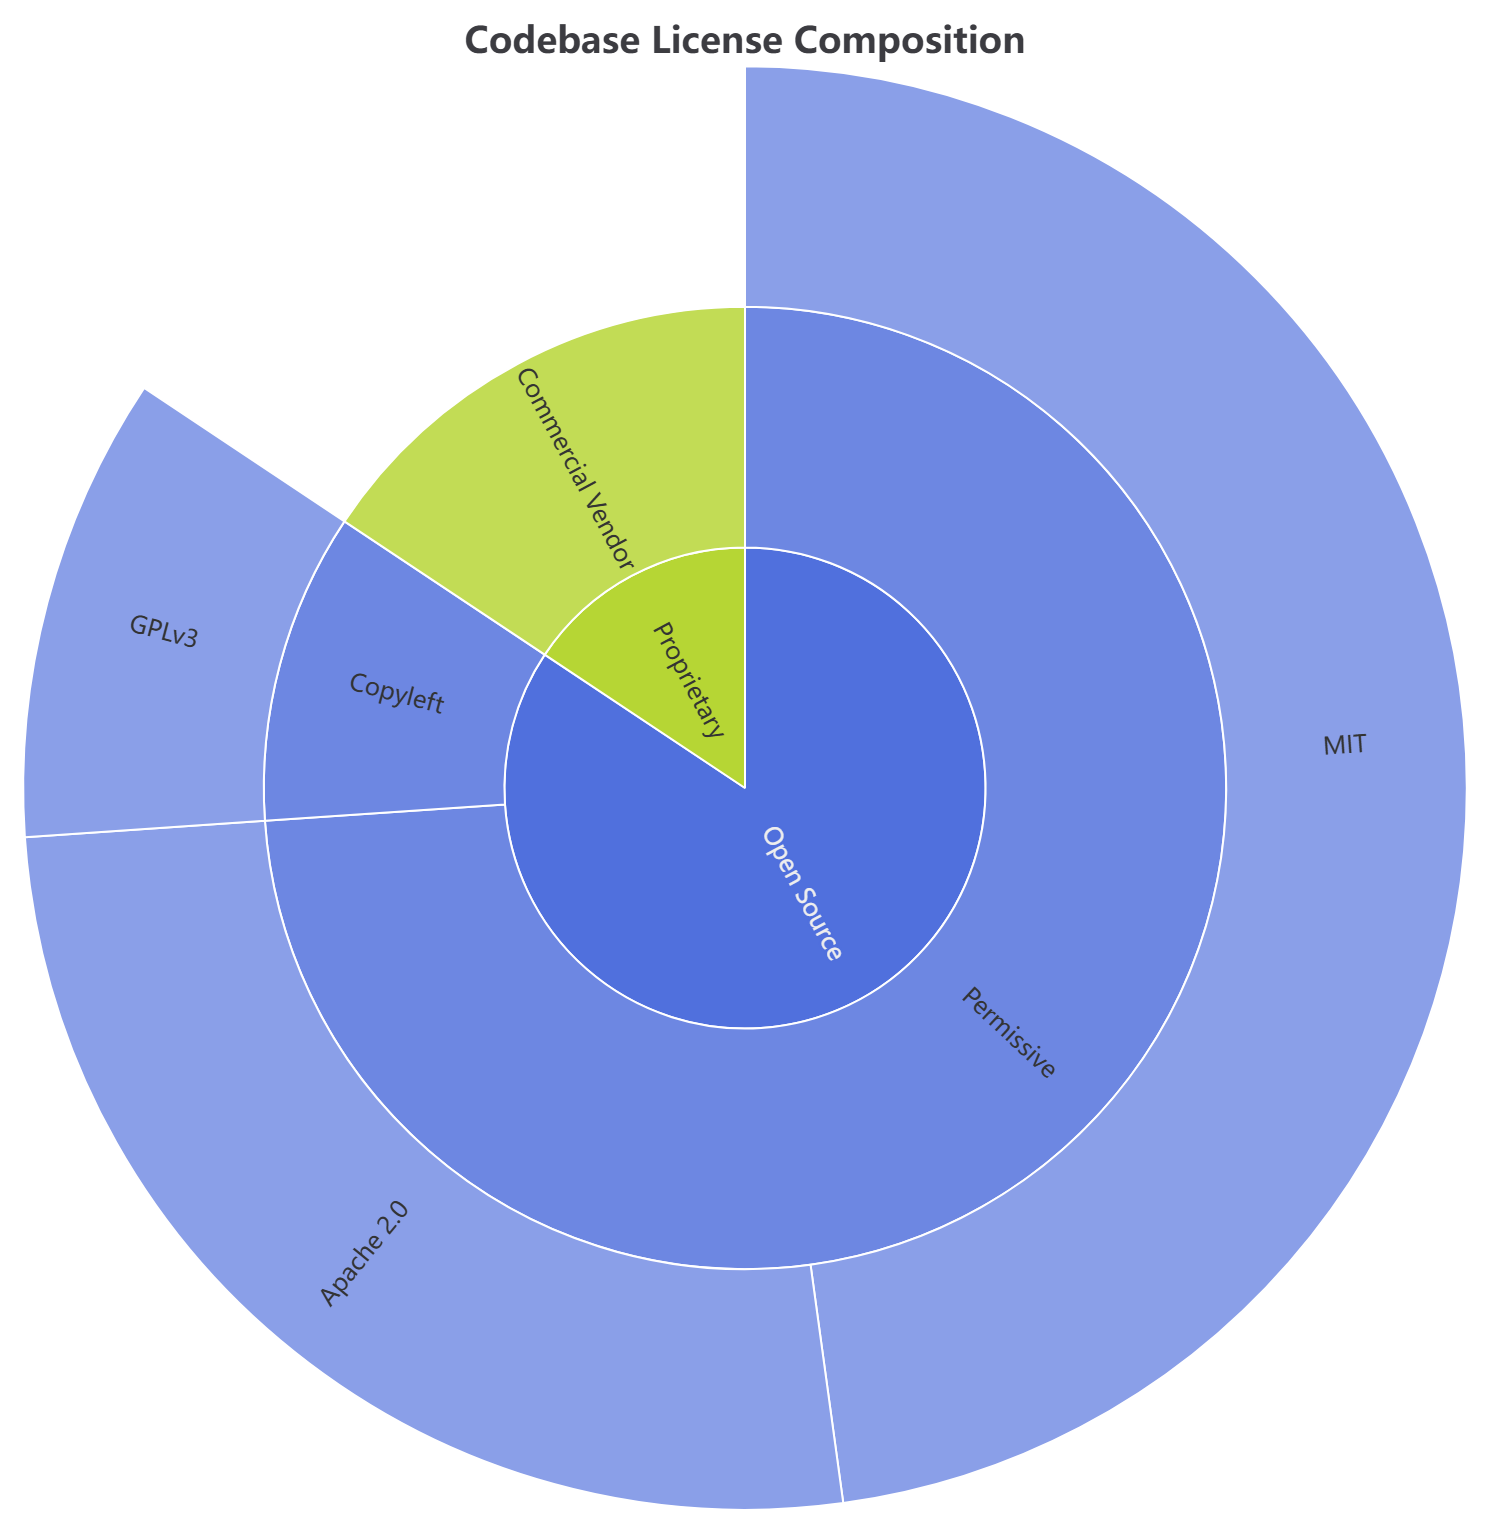
option = {
  title: { text: 'Codebase License Composition', left: 'center' },
  series: [{
    type: 'sunburst',
    radius: [0, '90%'],
    data: [{
      name: 'Open Source',
      children: [
        { name: 'Permissive', children: [{ name: 'MIT', value: 55 }, { name: 'Apache 2.0', value: 30 }] },
        { name: 'Copyleft', children: [{ name: 'GPLv3', value: 12 }] }
      ]
    }, {
      name: 'Proprietary',
      children: [{ name: 'Commercial Vendor', value: 18 }]
    }]
  }]
};8. Sankey Diagram (Infrastructure Cost Flow Analyzer)
Trace operational resource mapping or financial variables across computational steps with flowing node weight links.
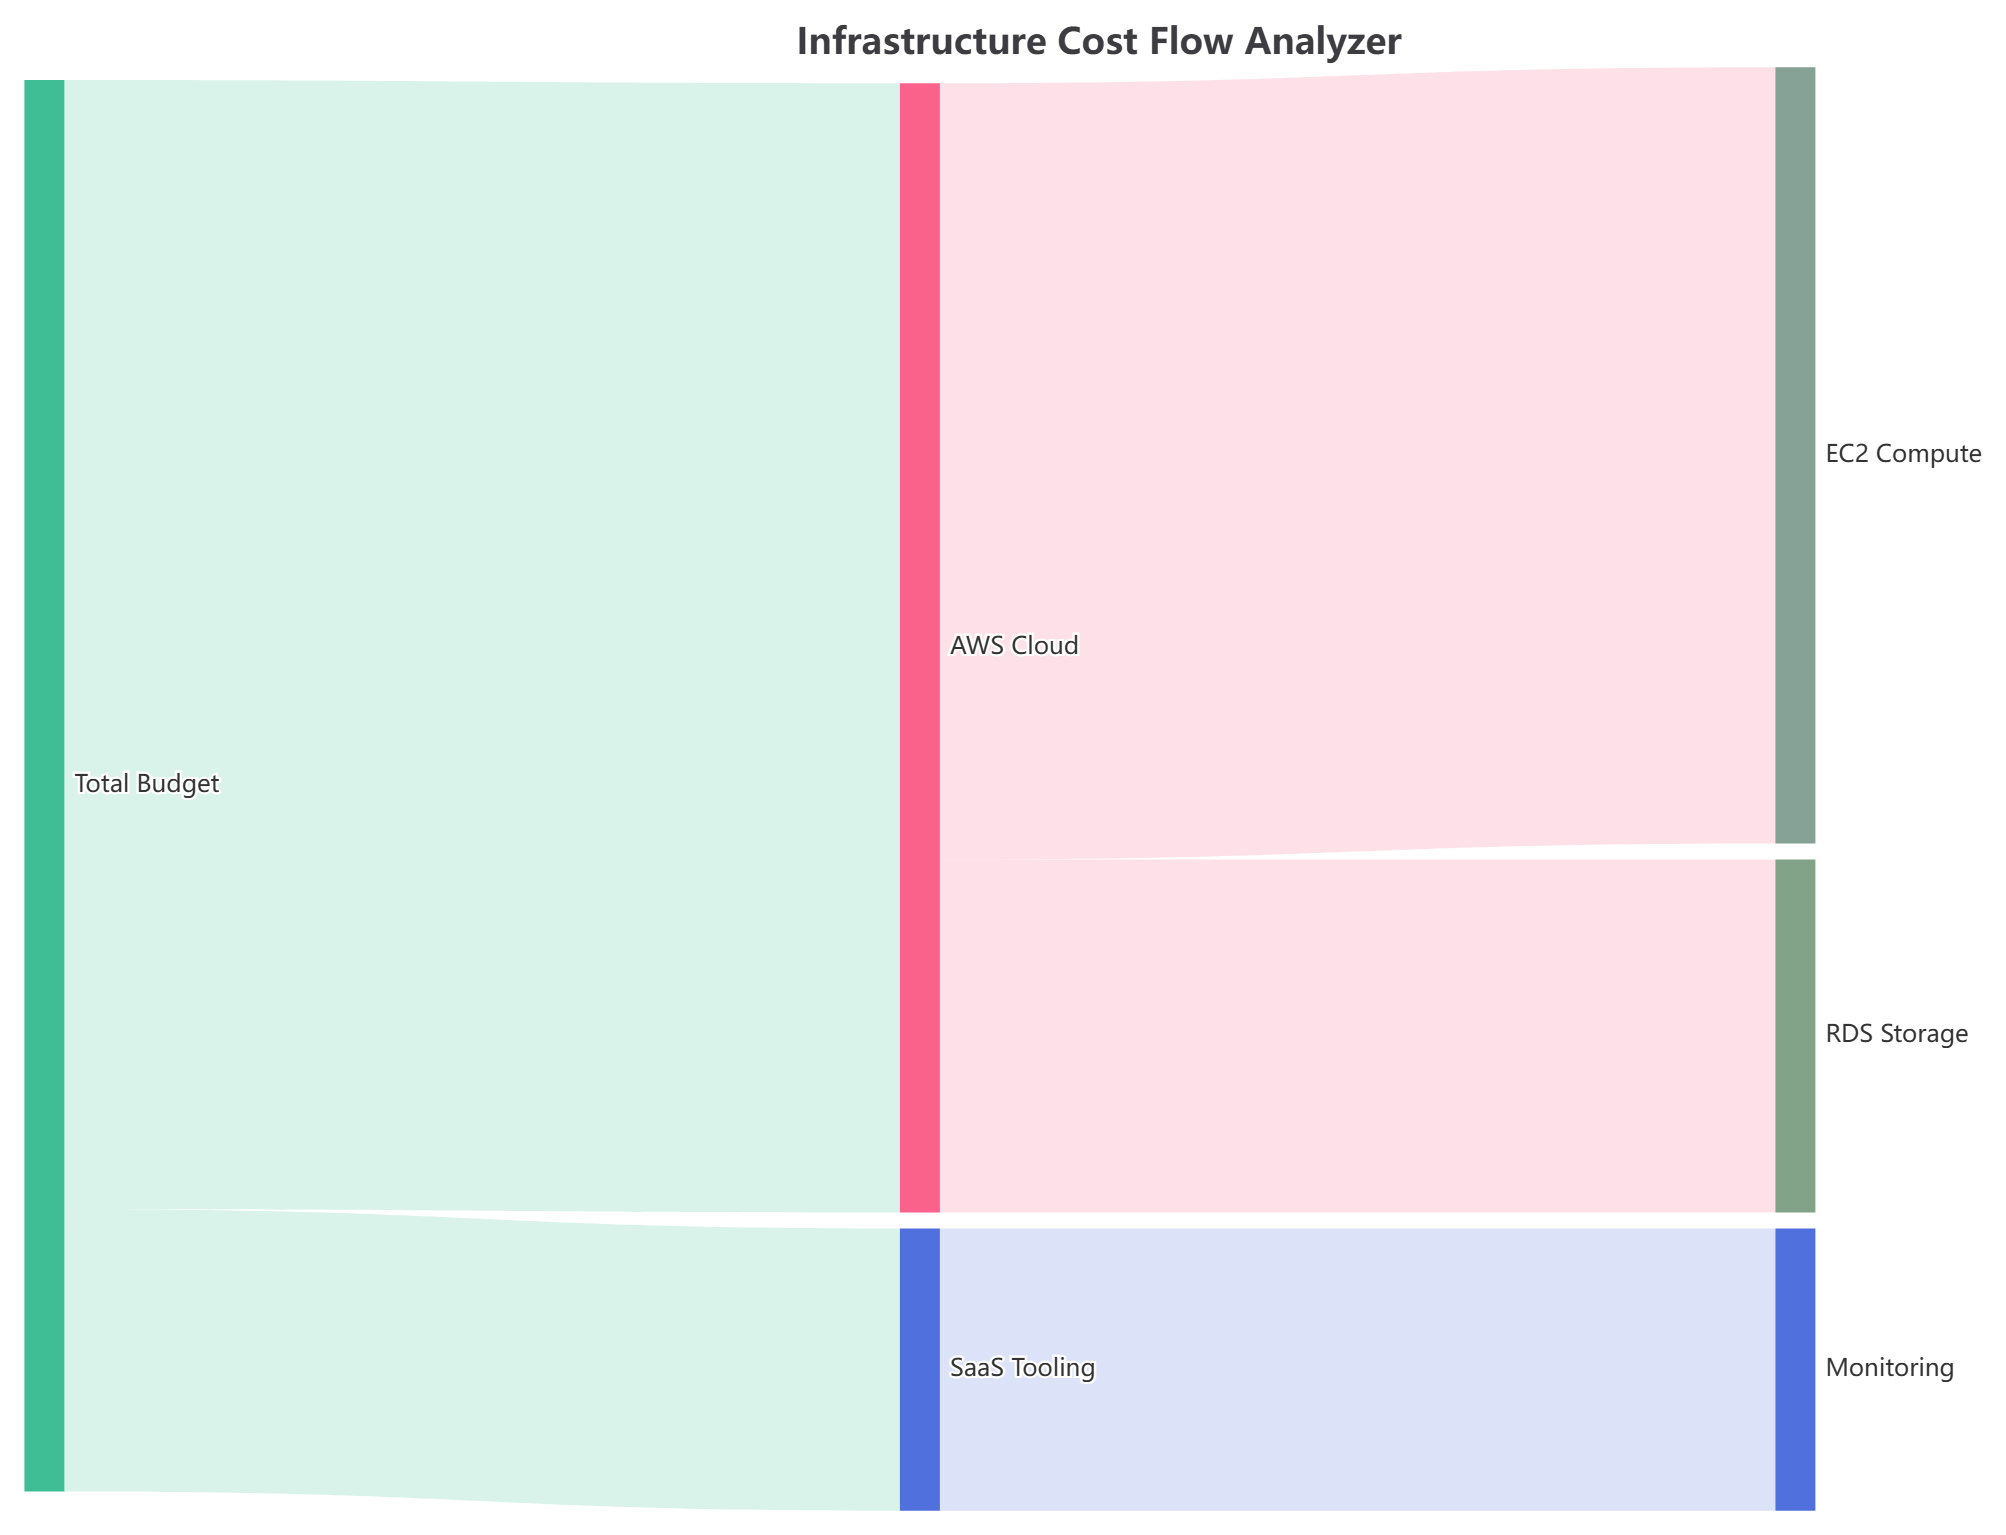
option = {
  title: { text: 'Infrastructure Cost Flow Analyzer' },
  tooltip: { trigger: 'item', triggerOn: 'mousemove' },
  series: [{
    type: 'sankey',
    data: [
      { name: 'Total Budget' }, { name: 'AWS Cloud' }, { name: 'SaaS Tooling' },
      { name: 'EC2 Compute' }, { name: 'RDS Storage' }, { name: 'Monitoring' }
    ],
    links: [
      { source: 'Total Budget', target: 'AWS Cloud', value: 8000 },
      { source: 'Total Budget', target: 'SaaS Tooling', value: 2000 },
      { source: 'AWS Cloud', target: 'EC2 Compute', value: 5500 },
      { source: 'AWS Cloud', target: 'RDS Storage', value: 2500 },
      { source: 'SaaS Tooling', target: 'Monitoring', value: 2000 }
    ],
    lineStyle: { color: 'source', curveness: 0.5 }
  }]
};9. Heatmap (Hourly Deployment Velocity Grid)
Monitor systemic densities, deployment volumes, or continuous traffic shifts across custom timeframe matrices easily.
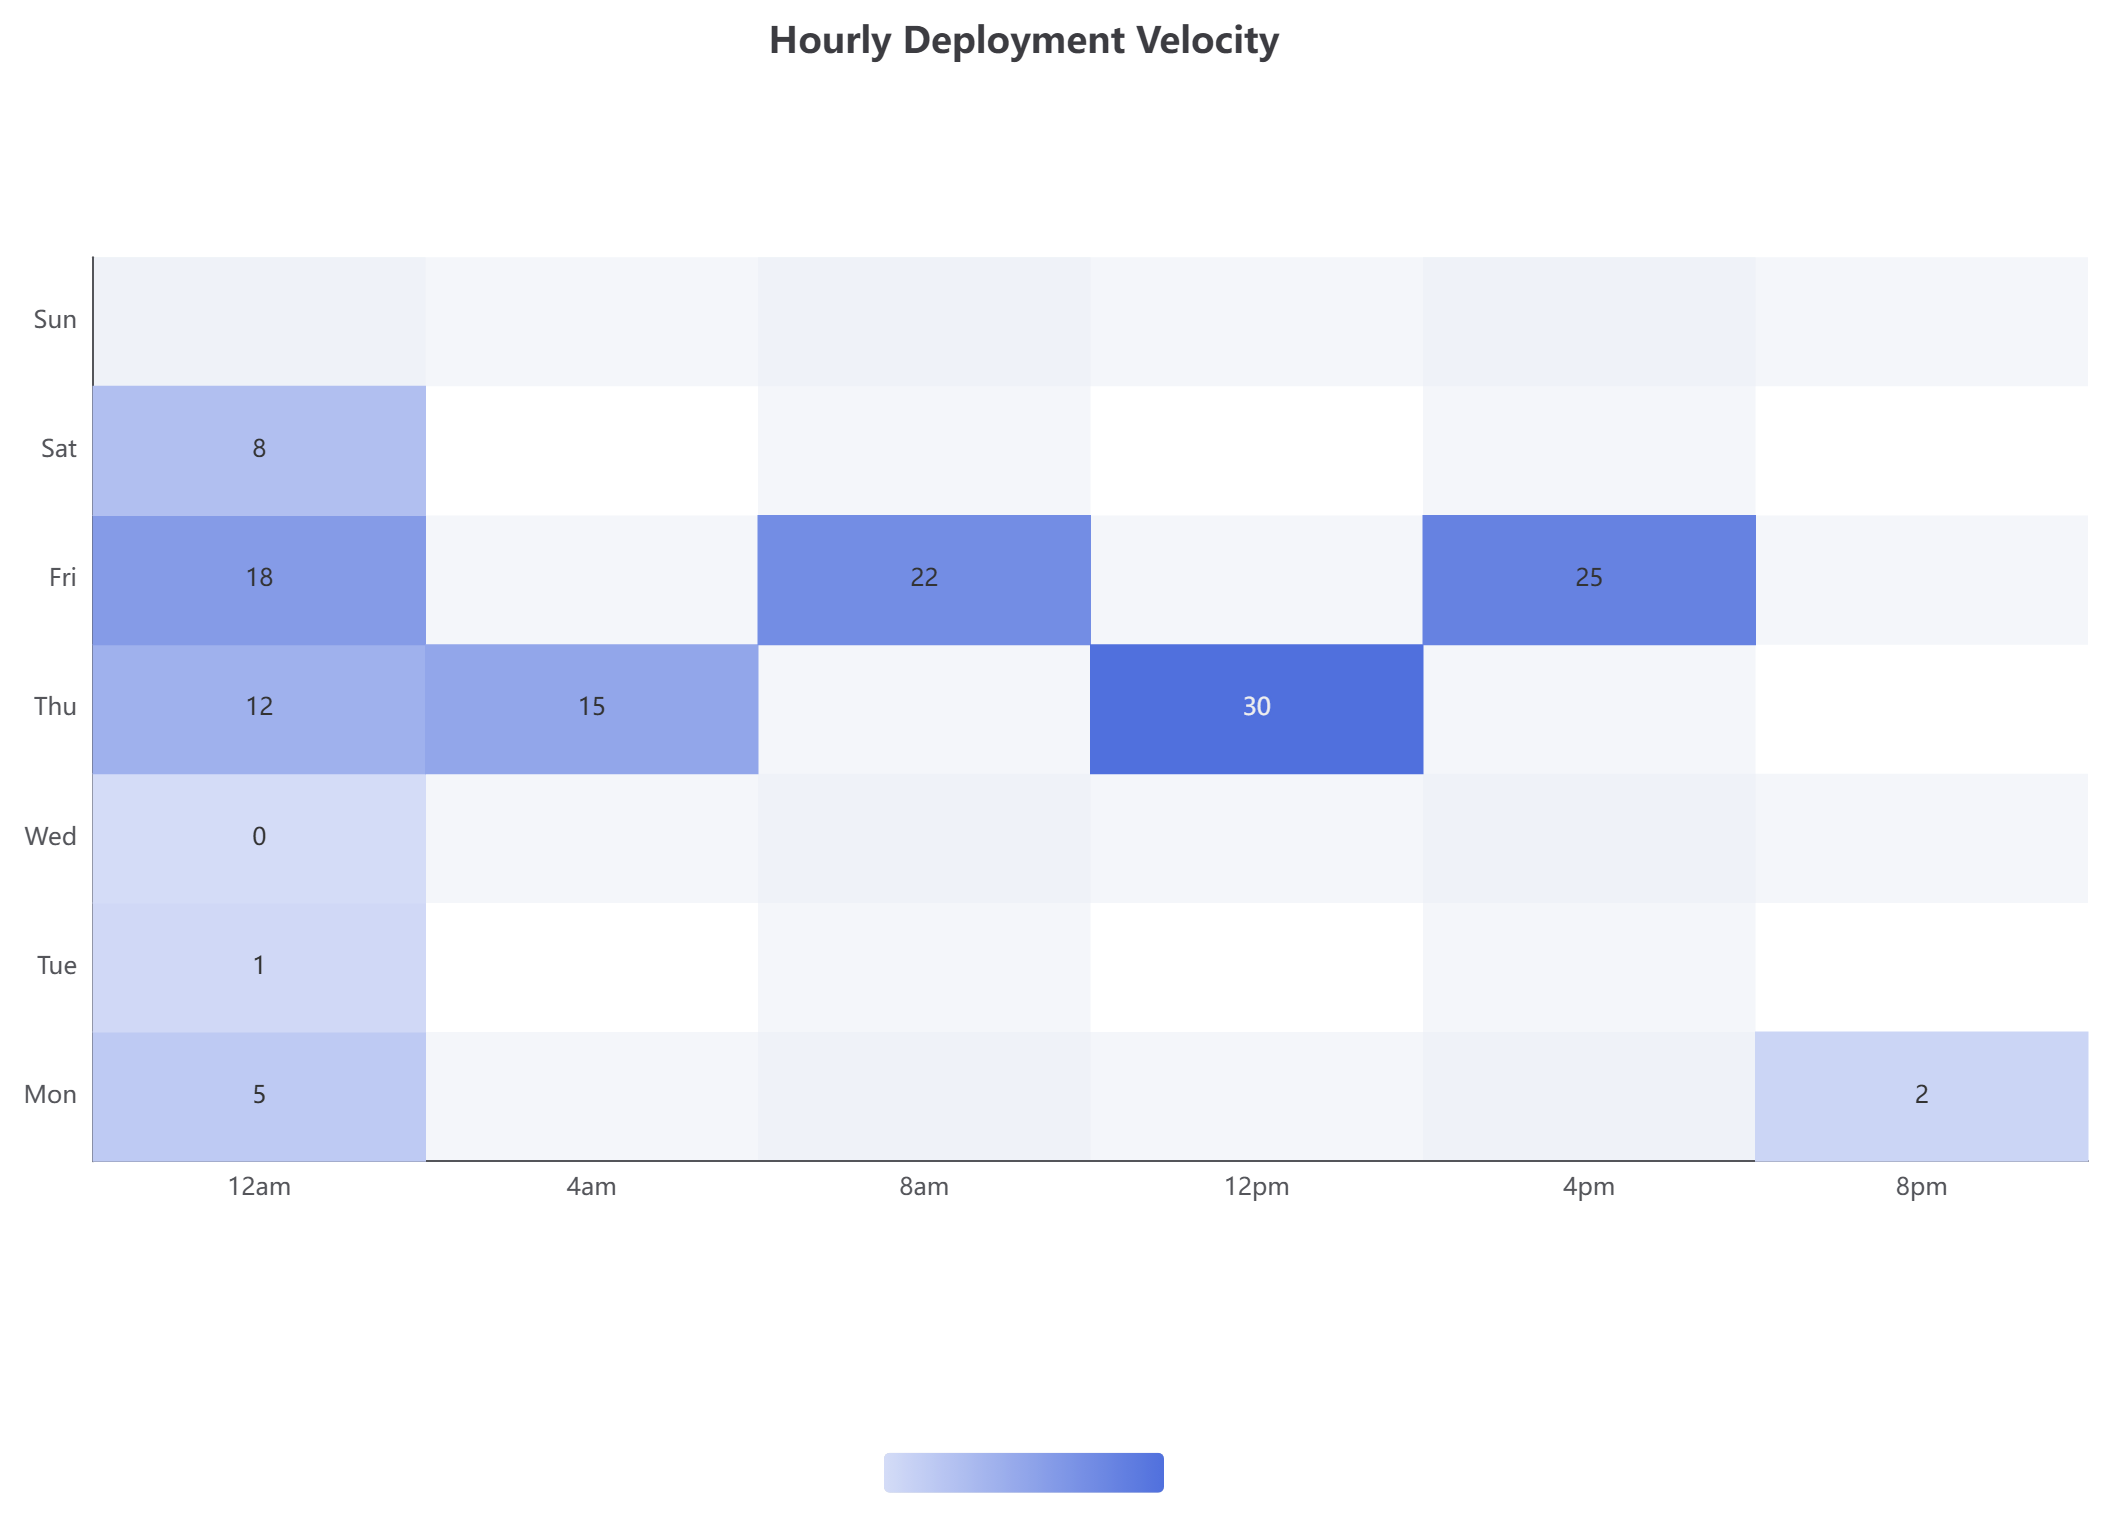
option = {
  title: { text: 'Hourly Deployment Velocity', left: 'center' },
  tooltip: { position: 'top' },
  grid: { height: '50%', top: '15%' },
  xAxis: { type: 'category', data: ['12am', '4am', '8am', '12pm', '4pm', '8pm'], splitArea: { show: true } },
  yAxis: { type: 'category', data: ['Mon', 'Tue', 'Wed', 'Thu', 'Fri', 'Sat', 'Sun'], splitArea: { show: true } },
  visualMap: { min: 0, max: 30, type: 'continuous', orient: 'horizontal', left: 'center', bottom: '15%' },
  series: [{
    name: 'Deployments',
    type: 'heatmap',
    data: [[0,0,5],[0,1,1],[0,2,0],[0,3,12],[0,4,18],[0,5,8],[1,3,15],[2,4,22],[3,3,30],[4,4,25],[5,0,2],[6,0,1]],
    label: { show: true },
    emphasis: { itemStyle: { shadowBlur: 10, shadowColor: 'rgba(0, 0, 0, 0.5)' } }
  }]
};Unlock the Power of Text-to-Diagram Automation Today
Whether you need an chart maker to translate raw business metrics or a centralized canvas for structural engineering maps, VPasCode streamlines your daily workflows. Say goodbye to fragmented applications and brittle visualization libraries.
Ready to transform your data structures into interactive visual dashboards?
Explore the full canvas, try out these templates, and test our rendering performance for free.
Launch the Live VPasCode Editor Now →