
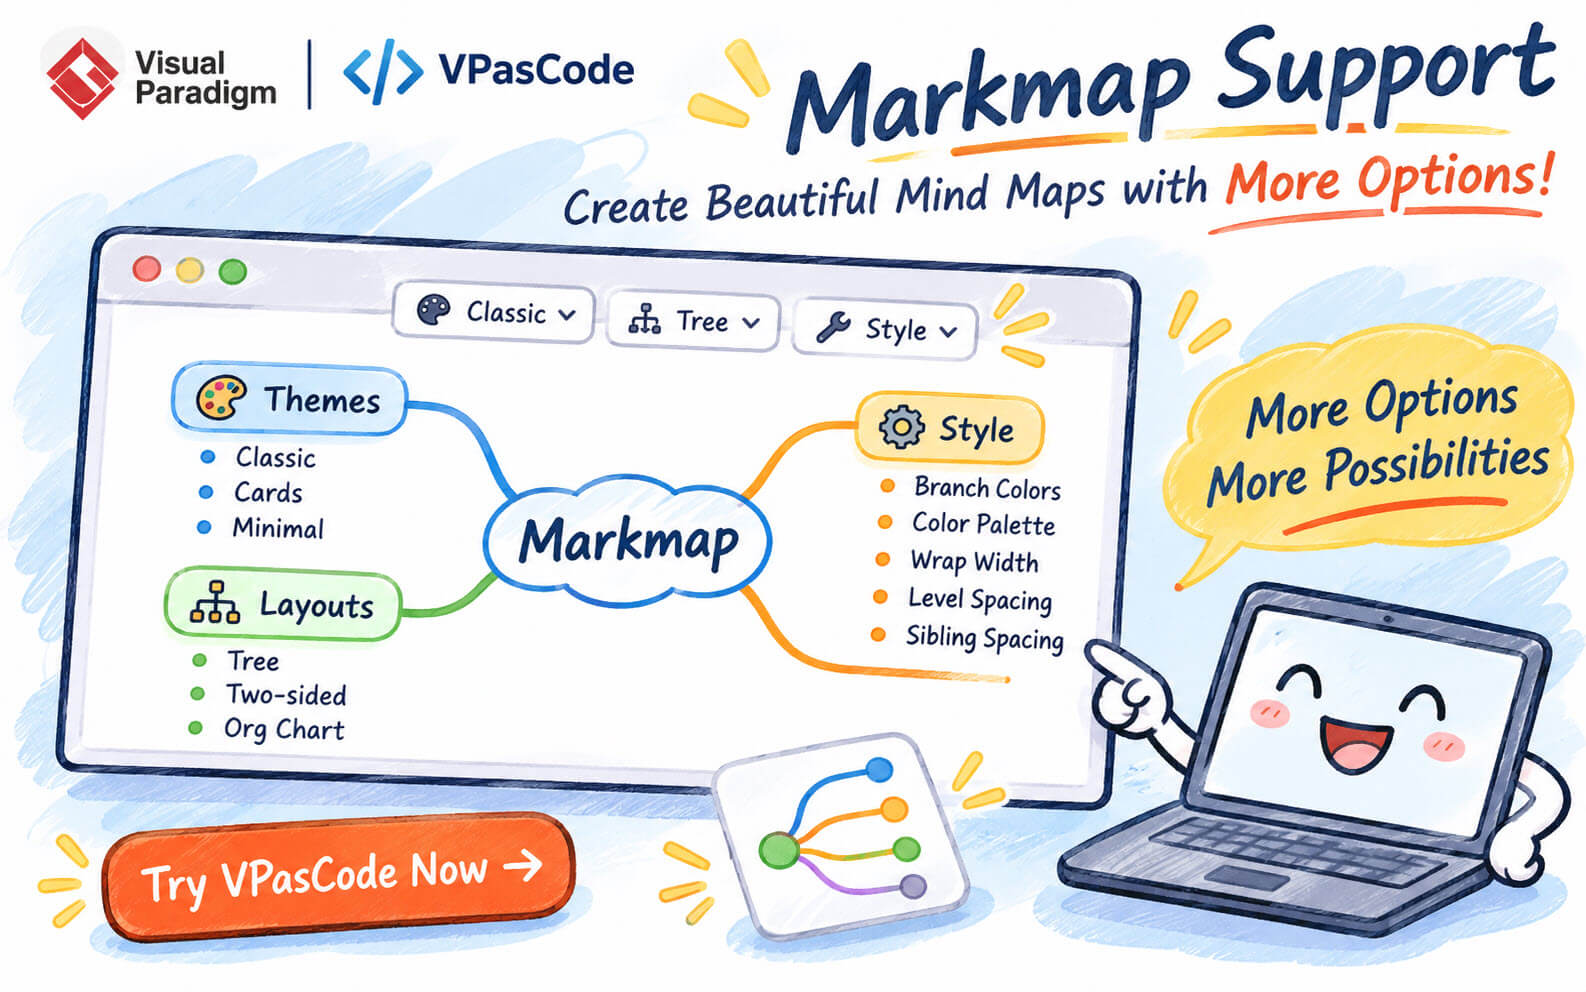
Visual Paradigm is pleased to announce an enhancement to VPasCode, our browser-based diagram-as-code platform. The Markmap editor has been upgraded with a new collection of customization options, giving users greater control over the appearance, layout, and readability of their Markdown-based mind maps.
With the enhanced Markmap editor, you can now choose from three visual themes, three layout configurations, and a range of styling controls. Whether you are creating a mind map for brainstorming, organizing a company’s reporting structure, planning a project, or presenting a complex set of ideas, you can tailor the visualization to suit your content and audience.
Best of all, these options are available directly within the VPasCode editor. Simply select your preferred settings from the new dropdown menus and see your mind map update instantly, without having to manually adjust the Markdown source.
Try the Enhanced Markmap Editor in VPasCode →
What Is Markmap and Why Use It in VPasCode?
Markmap is a tool that transforms Markdown content into interactive mind maps. Instead of manually drawing nodes, connecting branches, and arranging information on a canvas, you can describe your ideas using familiar Markdown headings and bullet points. Markmap then automatically converts that structured text into a visual mind map.
For example, a Markdown document containing a main heading, several subheadings, and nested bullet points can become a hierarchical mind map with connected branches. The deeper the heading or list nesting, the deeper the corresponding level in the visualization.
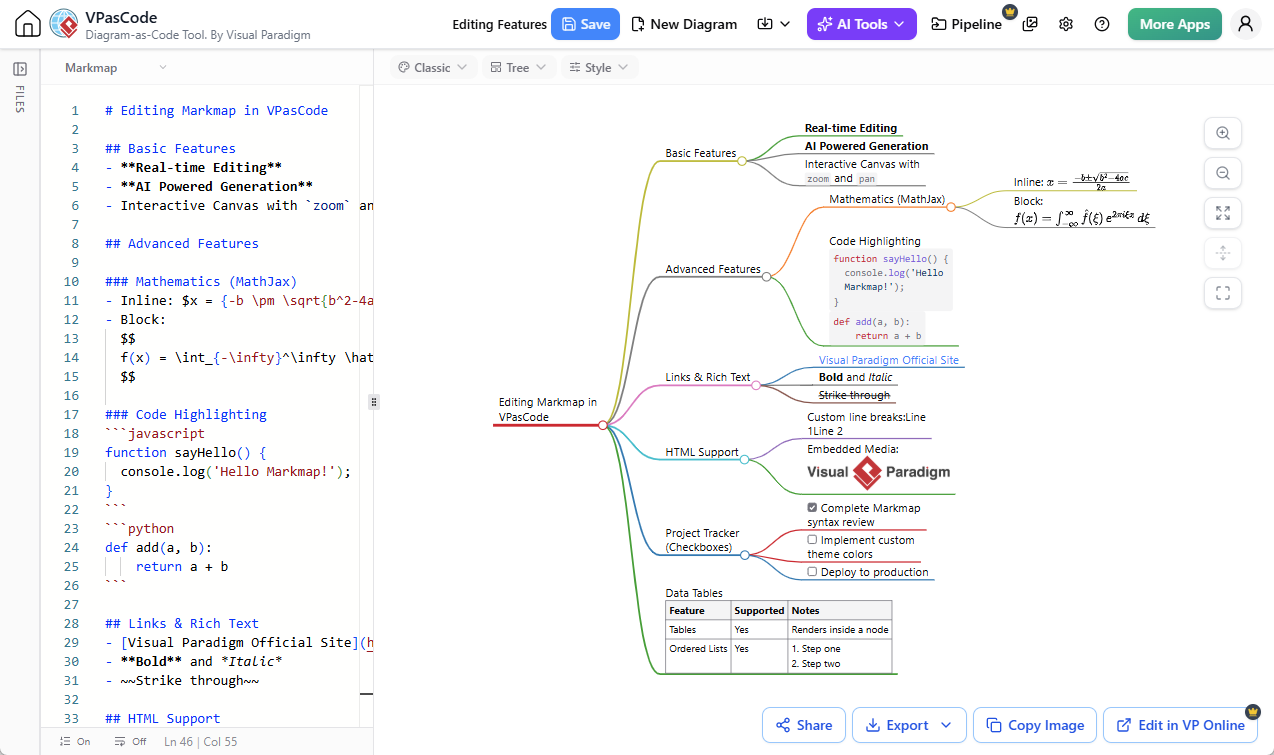
This approach offers several practical advantages:
- Simple authoring: Create mind maps using familiar Markdown syntax instead of manually drawing and connecting individual nodes.
- Easy editing: Add, remove, rename, or reorganize topics by modifying the underlying text.
- Structured information: Represent relationships between main topics, subtopics, and supporting details through a clear hierarchy.
- Efficient maintenance: Update an existing mind map by editing its source rather than rebuilding the entire diagram.
- Reusable content: Keep your information in a text-based format that can be maintained, revised, and reused in different workflows.
VPasCode brings this Markdown-to-mind-map capability into a unified online diagram-as-code environment. Rather than using separate applications for different diagramming languages, you can work with Markmap alongside other popular formats such as PlantUML, Mermaid, Graphviz, D2, and ECharts.
This makes VPasCode particularly useful for people who work with different kinds of visual content. You can create a technical diagram in one format, a data visualization in another, and a Markdown-based mind map in Markmap, all within the same platform.
What’s New: More Ways to Customize Your Markmap
The latest enhancement focuses on one important aspect of mind mapping: visual flexibility.
Different mind maps serve different purposes. A brainstorming mind map may benefit from colorful, flowing branches, while an organizational chart needs a more structured appearance. A mind map intended for a technical report may require a clean, understated presentation that keeps attention on the information itself.
Previously, users had fewer built-in options for adapting the visual presentation to these different needs. The enhanced VPasCode Markmap editor addresses this by introducing three groups of customization settings:
- Theme: Choose the overall visual appearance of your mind map.
- Layout: Decide how the branches are arranged around the root topic.
- Style: Fine-tune colors, text wrapping, and spacing.
Let’s take a closer look at each group.
1. Three Visual Themes for Different Mind Mapping Needs
A theme determines the overall visual language of a mind map, including how its nodes, branches, and text are presented. The enhanced Markmap tool introduces three themes: Classic, Cards, and Minimal.
Classic Theme: The Traditional Mind Mapping Experience
The Classic theme retains the familiar appearance of a traditional mind map. Its branches use colorful, curved connections, with text positioned directly along the branches rather than enclosed in individual boxes.
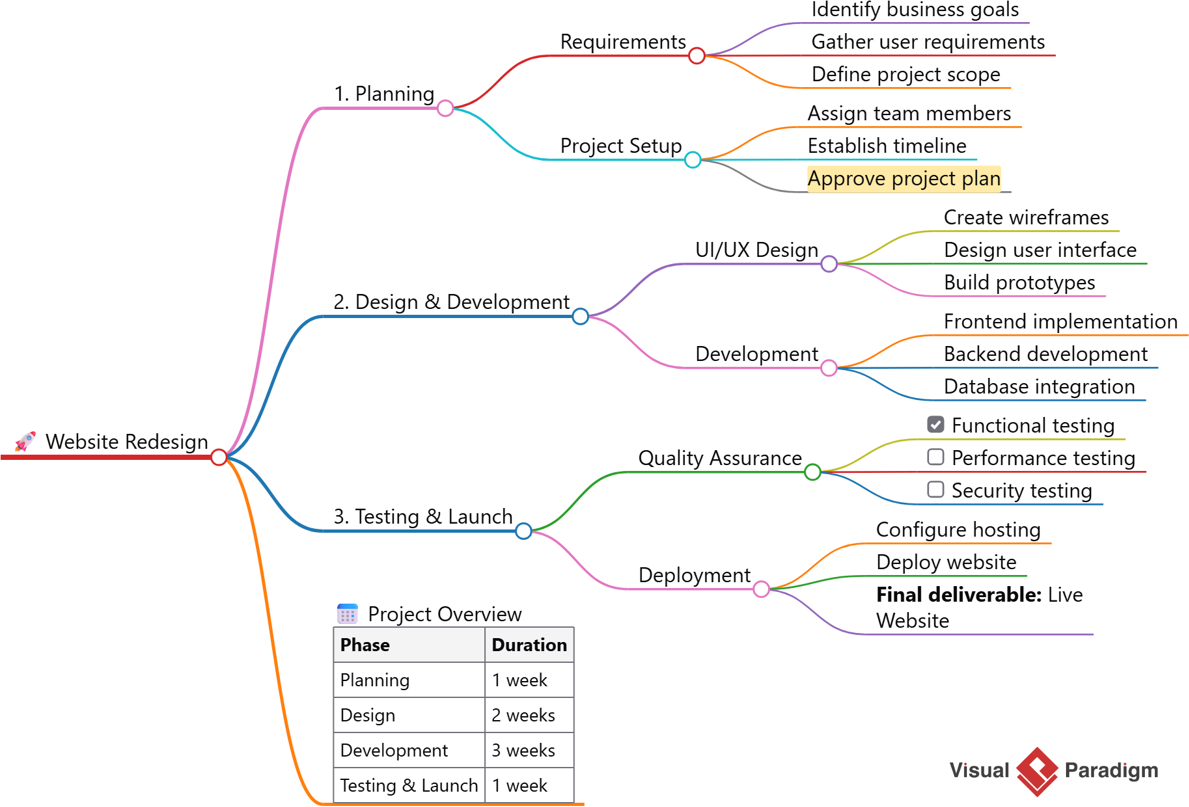
Edit this Markmap exmaple – Classic theme
This design emphasizes the relationships between topics and creates a natural flow from the central idea to its supporting branches.
The Classic theme is particularly suitable for:
- Brainstorming and idea generation.
- Exploring complex topics through hierarchical outlines.
- Creating information-rich mind maps with multiple levels of detail.
- Mapping concepts and their relationships.
If you enjoy the traditional mind mapping experience, Classic provides a familiar and expressive way to organize your thoughts.
Cards Theme: Structured Information in Distinct Boxes
The Cards theme presents mind map nodes inside distinct, bordered rectangular boxes connected by lines. Instead of placing text directly on the branches, it gives each topic its own clearly defined visual container.
This creates a more structured appearance, making individual topics easier to distinguish and scan.
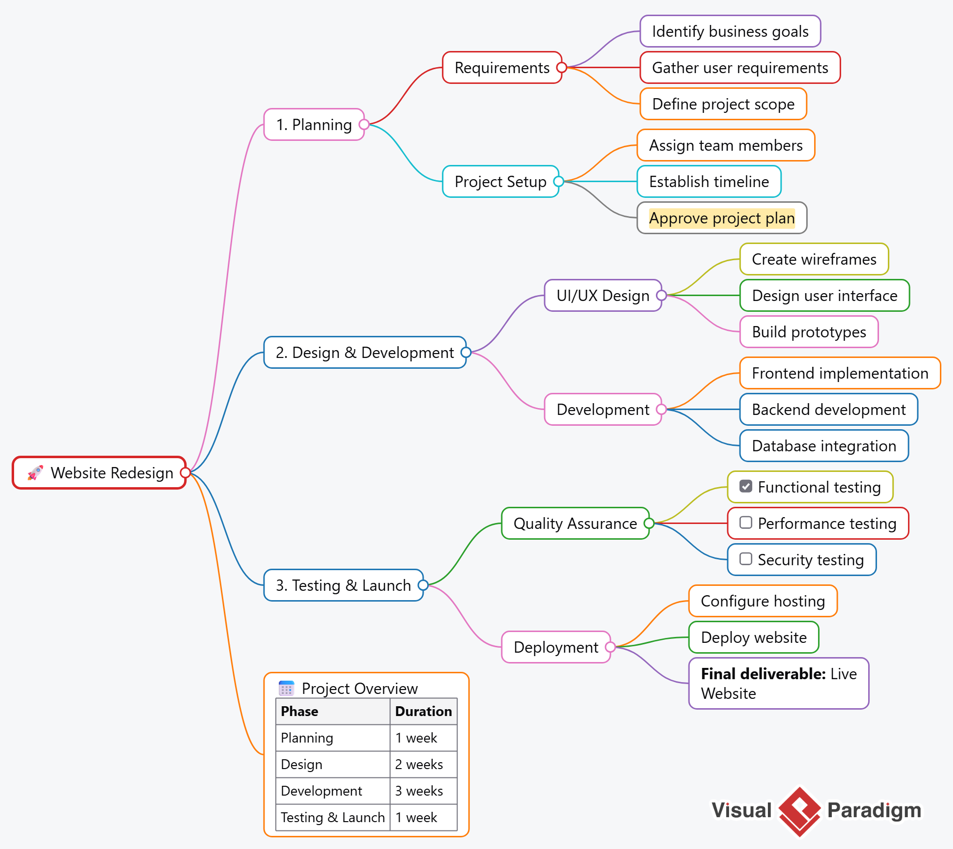
Edit this Markmap Example – Card theme
The Cards theme works especially well for:
- Organizational charts and reporting structures.
- Project plans and work breakdown structures.
- Structured workflows and decision-making processes.
- Mind maps containing richer content, such as images, tables, and notes.
For example, when creating an organizational chart, displaying each employee or department in a separate box can make the hierarchy easier to understand. Similarly, when mapping a project, individual task groups can be visually separated to improve readability.
Minimal Theme: A Clean and Distraction-Free Presentation
The Minimal theme takes a different approach. It uses thinner connections, muted styling, and reduced visual decoration to create a clean and understated appearance.
By minimizing visual distractions, this theme puts the emphasis on the actual content and the relationships between topics.
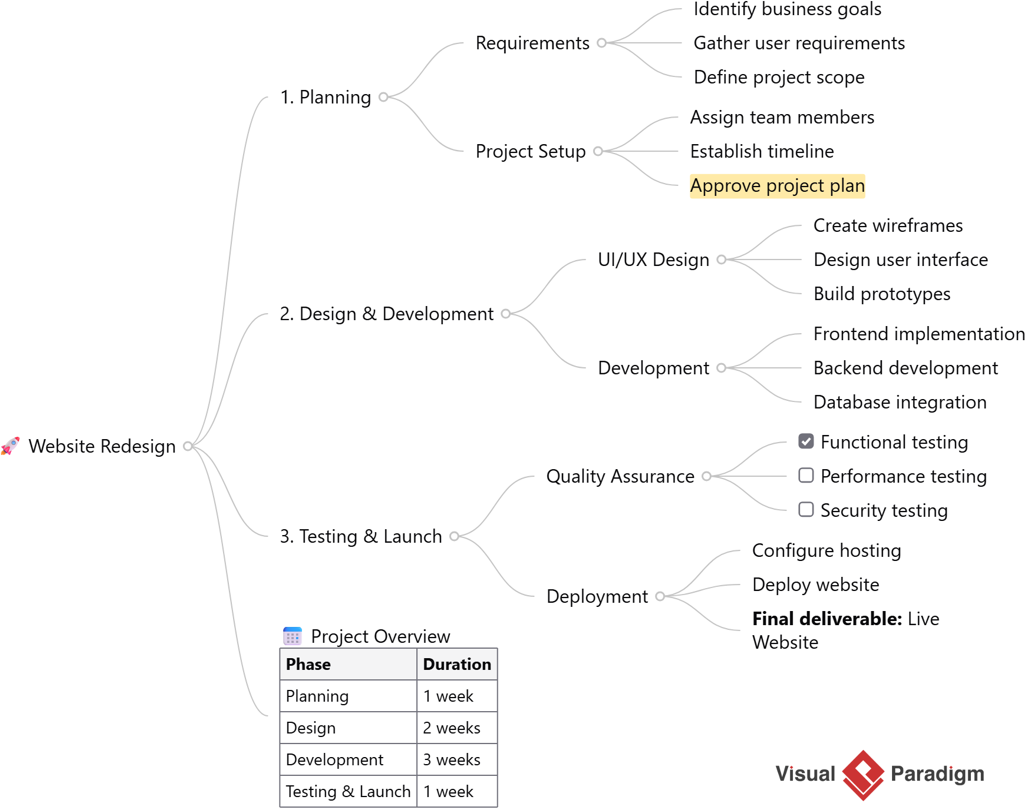
Edit this Markmap example – Minimal theme
It is particularly useful for:
- Presentations and professional reports.
- Embedding mind maps in documentation.
- Technical notes and knowledge organization.
- Large outlines where visual simplicity improves readability.
If your priority is to communicate information clearly without unnecessary visual decoration, Minimal is an excellent choice.
Three themes, three different experiences. You can switch between Classic, Cards, and Minimal whenever your presentation requirements change. There is no need to rewrite your Markdown content just to experiment with a different visual appearance.
2. Three Layout Options to Organize Your Ideas
Besides the overall theme, the arrangement of branches plays an important role in how people understand a mind map.
Some information is best presented as a conventional mind map growing outward from a central topic. Other information, such as an organizational hierarchy, is easier to understand when arranged from top to bottom.
To accommodate these different scenarios, the enhanced Markmap editor provides three layout options.
Tree Layout: The Classic Mind Map Structure
The Tree layout uses the familiar mind map structure, with the root topic positioned at the starting point and its branches growing outward to the right.
This is a natural choice for representing hierarchical information, where a main idea is broken down into progressively more specific topics and supporting details.
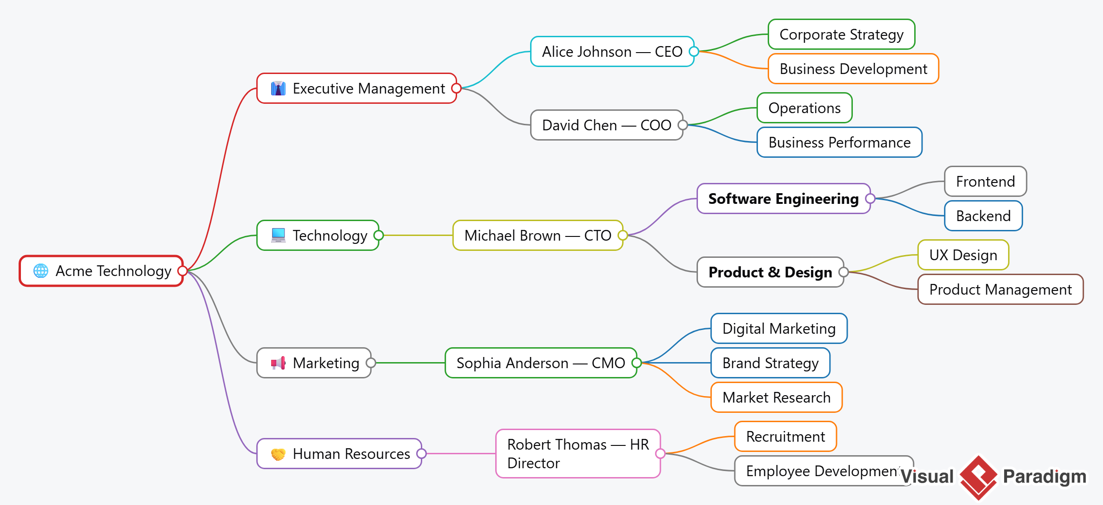
Edit this Markmap example – Tree layout
Typical applications include:
- Brainstorming and idea mapping.
- Knowledge organization and topic exploration.
- Study notes and learning materials.
- Requirements decomposition.
- Project planning and task breakdowns.
For users who want a straightforward Markdown-to-mind-map experience, Tree is an excellent default layout.
Two-Sided Layout: Balance Your Mind Map Around the Root
The Two-Sided layout distributes branches on both sides of the root topic instead of extending everything in a single direction.
This creates a more balanced composition, particularly when a mind map contains several major topics at the same hierarchical level.

Edit this Markmap example – Two-sided layout
It is useful for:
- Product strategy and business planning.
- Comparing different aspects of a subject.
- Mapping related concepts and categories.
- Presenting information with several major branches.
For example, a product launch strategy could be organized with product preparation on one side and go-to-market activities on the other. The two-sided arrangement makes the relationship between the main areas immediately visible.
Org Chart Layout: Visualize Hierarchies from Top to Bottom
The Org Chart layout arranges information in a top-down hierarchical structure. The root topic appears at the top, with subordinate topics and their supporting branches extending downward.
This arrangement is particularly suitable for information that naturally follows a reporting, management, or parent-child hierarchy.
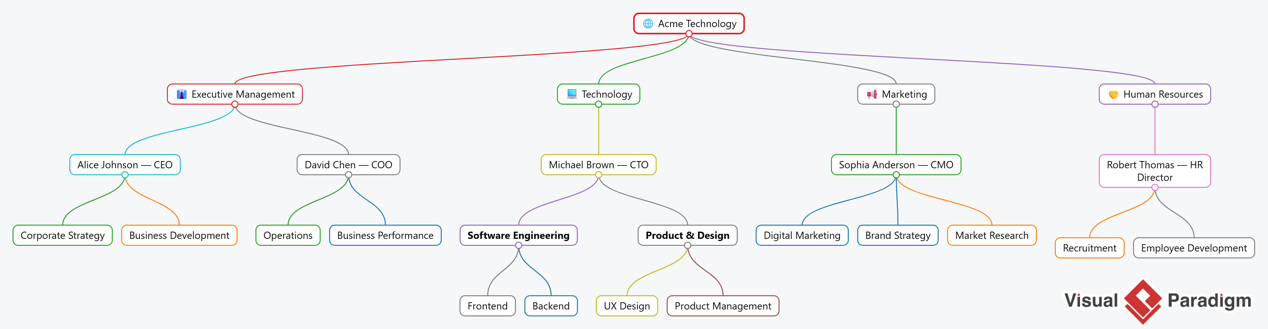
Edit this Markmap example – Org Chart layout
Common use cases include:
- Corporate organizational charts.
- Department and team structures.
- Management and reporting hierarchies.
- Project ownership and responsibility structures.
- Hierarchical plans and classification systems.
For example, you can describe a company’s management structure using Markdown headings and let Markmap arrange executives, departments, and supporting teams in a top-down organization chart.
The Org Chart layout provides a convenient way to create hierarchical visualizations without manually arranging individual boxes and connectors.
3. Fine-Tune Your Mind Map with Advanced Styling Options
Selecting a theme and layout establishes the overall appearance of your mind map. However, different projects may still require additional adjustments to achieve the desired presentation.
The enhanced VPasCode Markmap editor introduces several styling options that let you fine-tune the visual result.
Branch Colors: Choose How Colors Are Applied
Color is an effective way to distinguish different topics and make a mind map easier to navigate. The enhanced editor provides three branch color modes:
- Per Node: Apply colors at the individual node level, allowing different nodes to have their own visual colors.
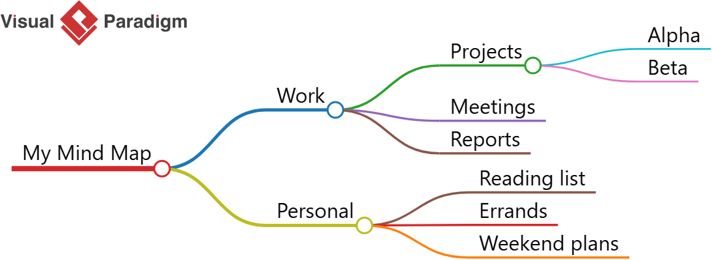
- Per Branch: Apply a consistent color to a branch and its related nodes, helping distinguish major topic groups.
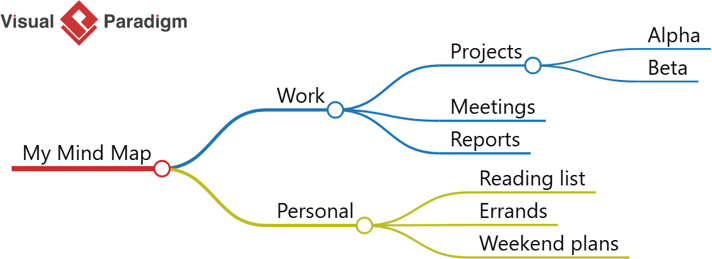
- Single Color: Use one consistent color throughout the mind map for a more unified appearance.
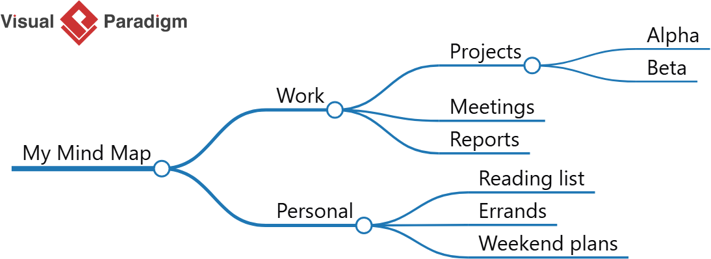
These options let you decide whether to emphasize individual topics, distinguish major branches, or maintain a consistent visual identity.
For example, a project plan could use different colors for its major phases, making it easier to identify which tasks belong to planning, development, testing, or deployment.
Color Palette: Personalize the Visual Appearance
In addition to choosing how colors are distributed, you can select a color palette to determine the colors used in your mind map.
A suitable palette can make a large difference in the overall presentation. You might prefer vibrant colors for brainstorming, a coordinated palette for business documentation, or a restrained color scheme for professional presentations.
Combined with the Per Node, Per Branch, and Single Color modes, the palette gives you greater control over the visual identity of your Markmap diagrams.
Wrap Width: Improve Text Readability
Some mind map nodes contain short labels, while others need longer descriptions to communicate their meaning.
When node text becomes too long, it can affect the overall balance and readability of the diagram. The Wrap Width option addresses this by allowing you to configure the maximum pixel width of a node’s text before it wraps onto a new line.
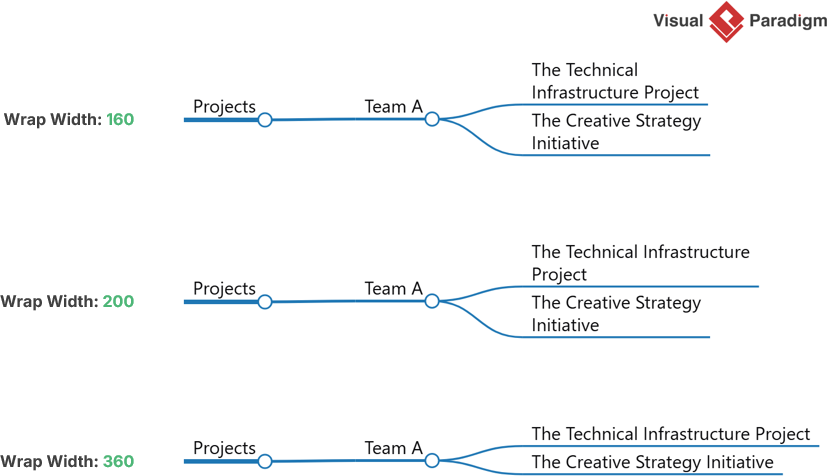
This is particularly useful when:
- Working with descriptive topic names.
- Creating detailed mind maps with explanatory text.
- Presenting technical concepts that require longer labels.
- Keeping the overall mind map within a preferred viewing area.
By adjusting the wrap width, you can control how text occupies space within the mind map and avoid unnecessarily wide nodes.
Level Spacing: Control the Distance Between Hierarchical Levels
A mind map communicates relationships through its hierarchical structure. The distance between one level and the next can influence how clearly that structure is perceived.
Level Spacing controls the visual distance between different levels of mind map nodes.
Increasing the spacing can make a dense hierarchy feel more open, while reducing it can help fit a large mind map into a more compact viewing area.
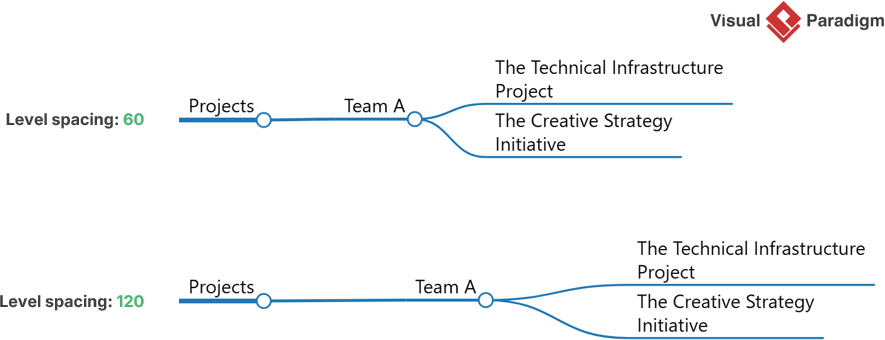
This setting is particularly helpful when working with deeply nested information, such as technical documentation, requirements breakdowns, or comprehensive project plans.
Sibling Spacing: Adjust the Gap Between Related Topics
Sibling nodes are topics that share the same parent node. When a mind map contains many sibling topics, the space between them can affect how easily readers distinguish individual branches.
Sibling Spacing lets you adjust the gap between sibling nodes, giving you greater control over the density and overall balance of your mind map.
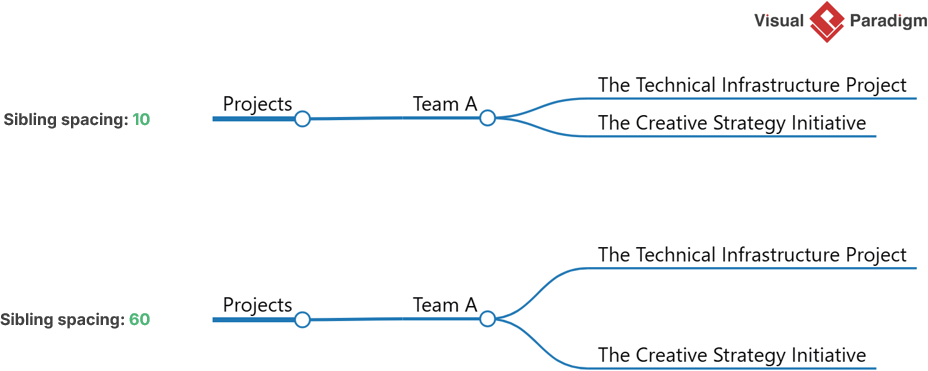
Use more spacing when you want individual topics to stand apart, or reduce the gap when you need a more compact visualization.
Together, Wrap Width, Level Spacing, and Sibling Spacing help you refine the presentation of your mind map without changing its underlying information structure.
How to Use the Enhanced Markmap Editor in VPasCode
One of the key goals of this enhancement is to make mind map customization straightforward. You do not need to learn additional Markmap configuration syntax or manually modify your Markdown source every time you want to change the appearance of your diagram.
All the new options are accessible directly from the VPasCode editor.
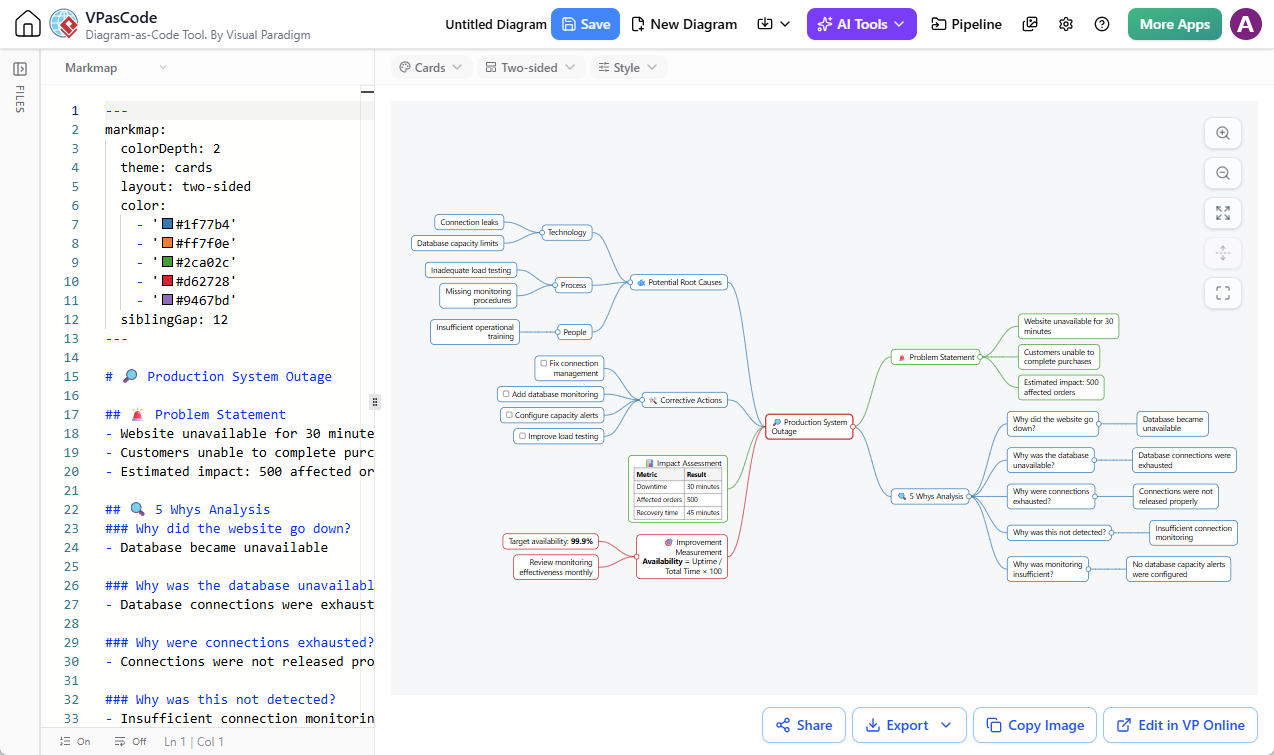
Step 1: Open a Markmap in VPasCode
Visit the VPasCode online editor and make sure you are working with a Markmap document.
You can create a new Markmap using Markdown or open an existing Markmap script to continue working on it.
---
markmap:
  colorDepth: 2
  theme: cards
  layout: two-sided
  color:
    - '#1f77b4'
    - '#ff7f0e'
    - '#2ca02c'
    - '#d62728'
    - '#9467bd'
  siblingGap: 12
---

# 🔎 Production System Outage

## 🚨 Problem Statement
- Website unavailable for 30 minutes
- Customers unable to complete purchases
- Estimated impact: 500 affected orders

## 🔍 5 Whys Analysis
### Why did the website go down?
- Database became unavailable

### Why was the database unavailable?
- Database connections were exhausted

### Why were connections exhausted?
- Connections were not released properly

### Why was this not detected?
- Insufficient connection monitoring

### Why was monitoring insufficient?
- No database capacity alerts were configured

## 🐟 Potential Root Causes
### Technology
- Connection leaks
- Database capacity limits

### Process
- Inadequate load testing
- Missing monitoring procedures

### People
- Insufficient operational training

## 🛠️ Corrective Actions
- [ ] Fix connection management
- [ ] Add database monitoring
- [ ] Configure capacity alerts
- [ ] Improve load testing

## 📊 Impact Assessment

| Metric | Result |
|---|---:|
| Downtime | 30 minutes |
| Affected orders | 500 |
| Recovery time | 45 minutes |

## 🎯 Improvement Measurement
**Availability** = Uptime / Total Time × 100

- Target availability: **99.9%**
- Review monitoring effectiveness monthlyStep 2: Locate the Customization Menus
Once your Markmap is displayed in the viewer, look at the controls above the visualization.
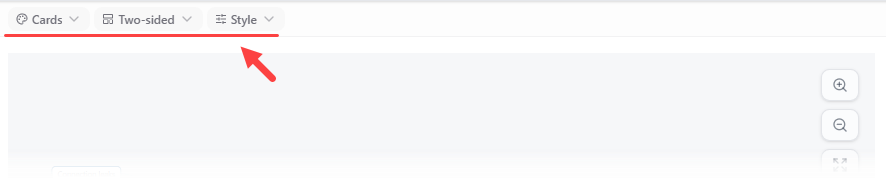
You will find three dropdown menus:
- Theme: Choose Classic, Cards, or Minimal.
- Layout: Choose Tree, Two-Sided, or Org Chart.
- Style: Access the visual styling options, including branch colors, color palette, text wrapping, and spacing.
Step 3: Select Your Preferred Options
Click the corresponding dropdown menu and select the option you want to apply.
For example, you can switch from Classic to Cards, change the layout from Tree to Two-sided, or adjust the branch colors and spacing to suit your content.
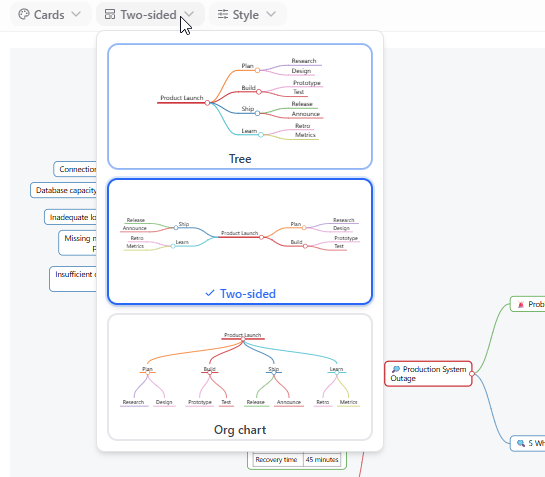
Step 4: See Your Changes Instantly
There is no need to manually refresh the diagram or regenerate the Markdown source. The Markmap viewer re-renders automatically whenever you change a setting.
This immediate visual feedback makes it easy to experiment with different combinations until you find an appearance that works best for your mind map.
In just a few clicks, you can transform the same Markdown content into several different visual presentations.
What Can You Create with the Enhanced Markmap Tool?
The combination of Markdown-based authoring, multiple layouts, and flexible styling makes VPasCode a versatile online Markmap editor for a wide range of applications.
Here are some practical examples of how you can use it.
1. Organizational Charts
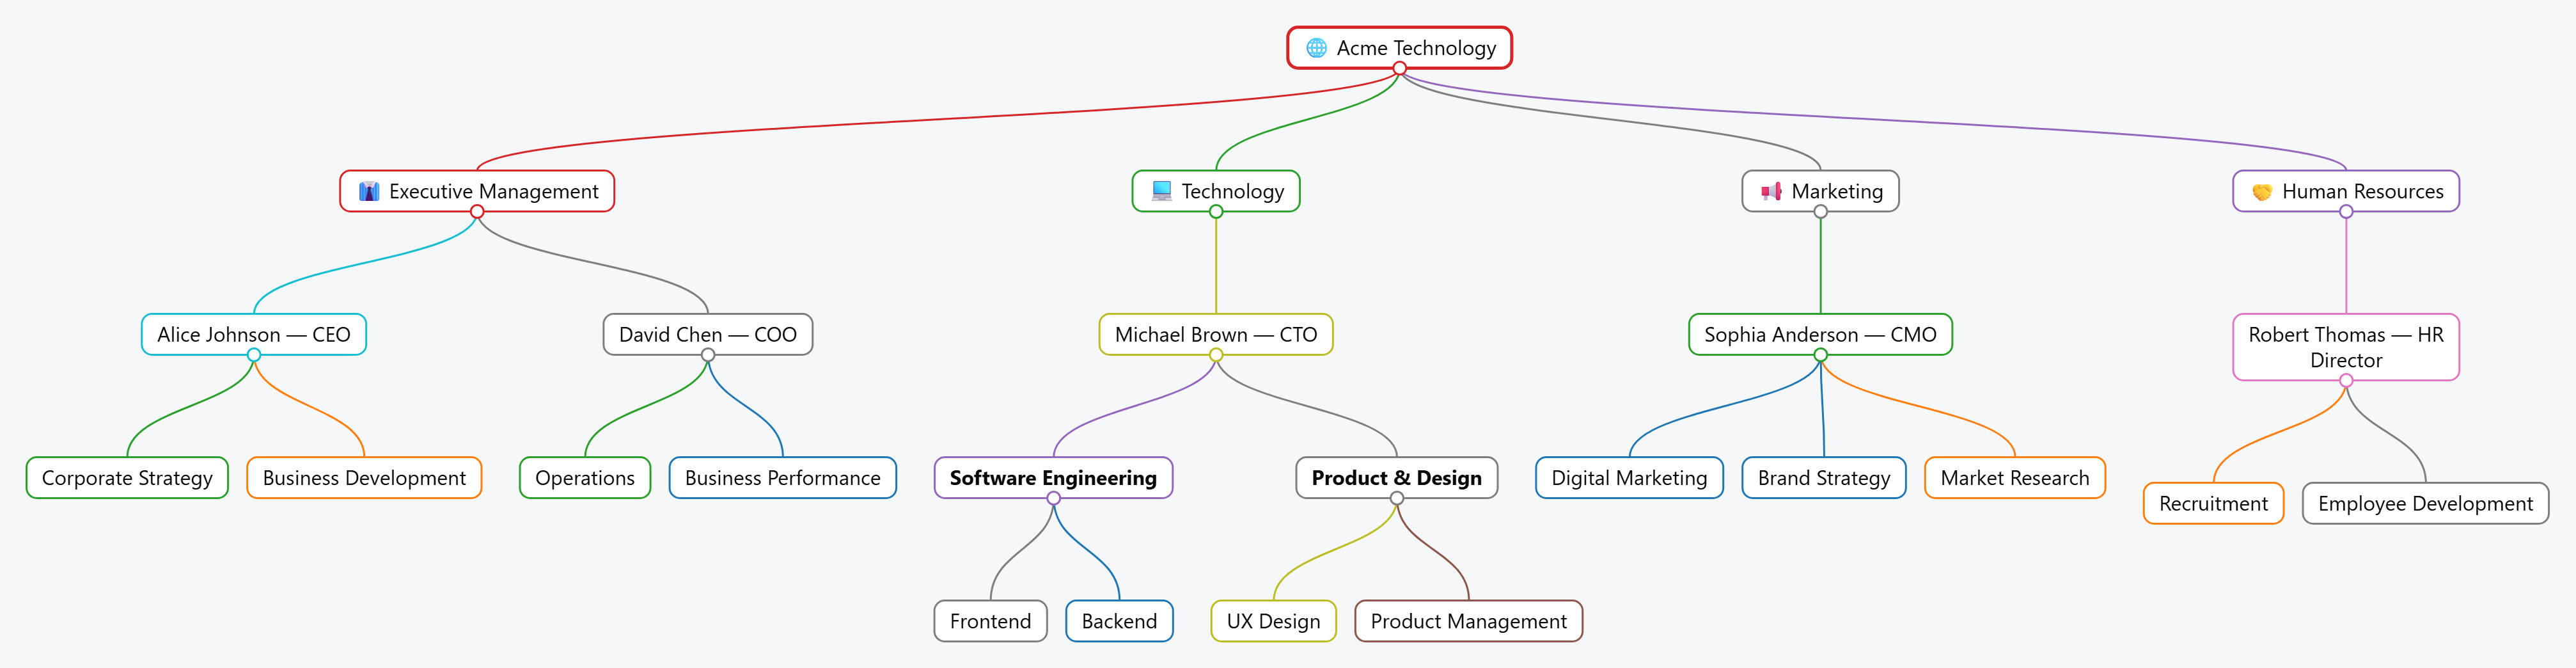
Use Markdown headings to describe a company’s management structure, departments, and reporting relationships. Apply the Cards theme and Org Chart layout to produce a structured, top-down visualization.
This is a convenient approach for creating organizational overviews, team structures, and responsibility hierarchies.
---
markmap:
  layout: org-chart
  theme: cards
---

# 🌐 Acme Technology

## 👔 Executive Management
### Alice Johnson — CEO
- Corporate Strategy
- Business Development

### David Chen — COO
- Operations
- Business Performance

## 💻 Technology
### Michael Brown — CTO
- **Software Engineering**
  - Frontend
  - Backend
- **Product & Design**
  - UX Design
  - Product Management

## 📢 Marketing
### Sophia Anderson — CMO
- Digital Marketing
- Brand Strategy
- Market Research

## 🤝 Human Resources
### Robert Thomas — HR Director
- Recruitment
- Employee Development
2. Work Breakdown Structures and Project Plans
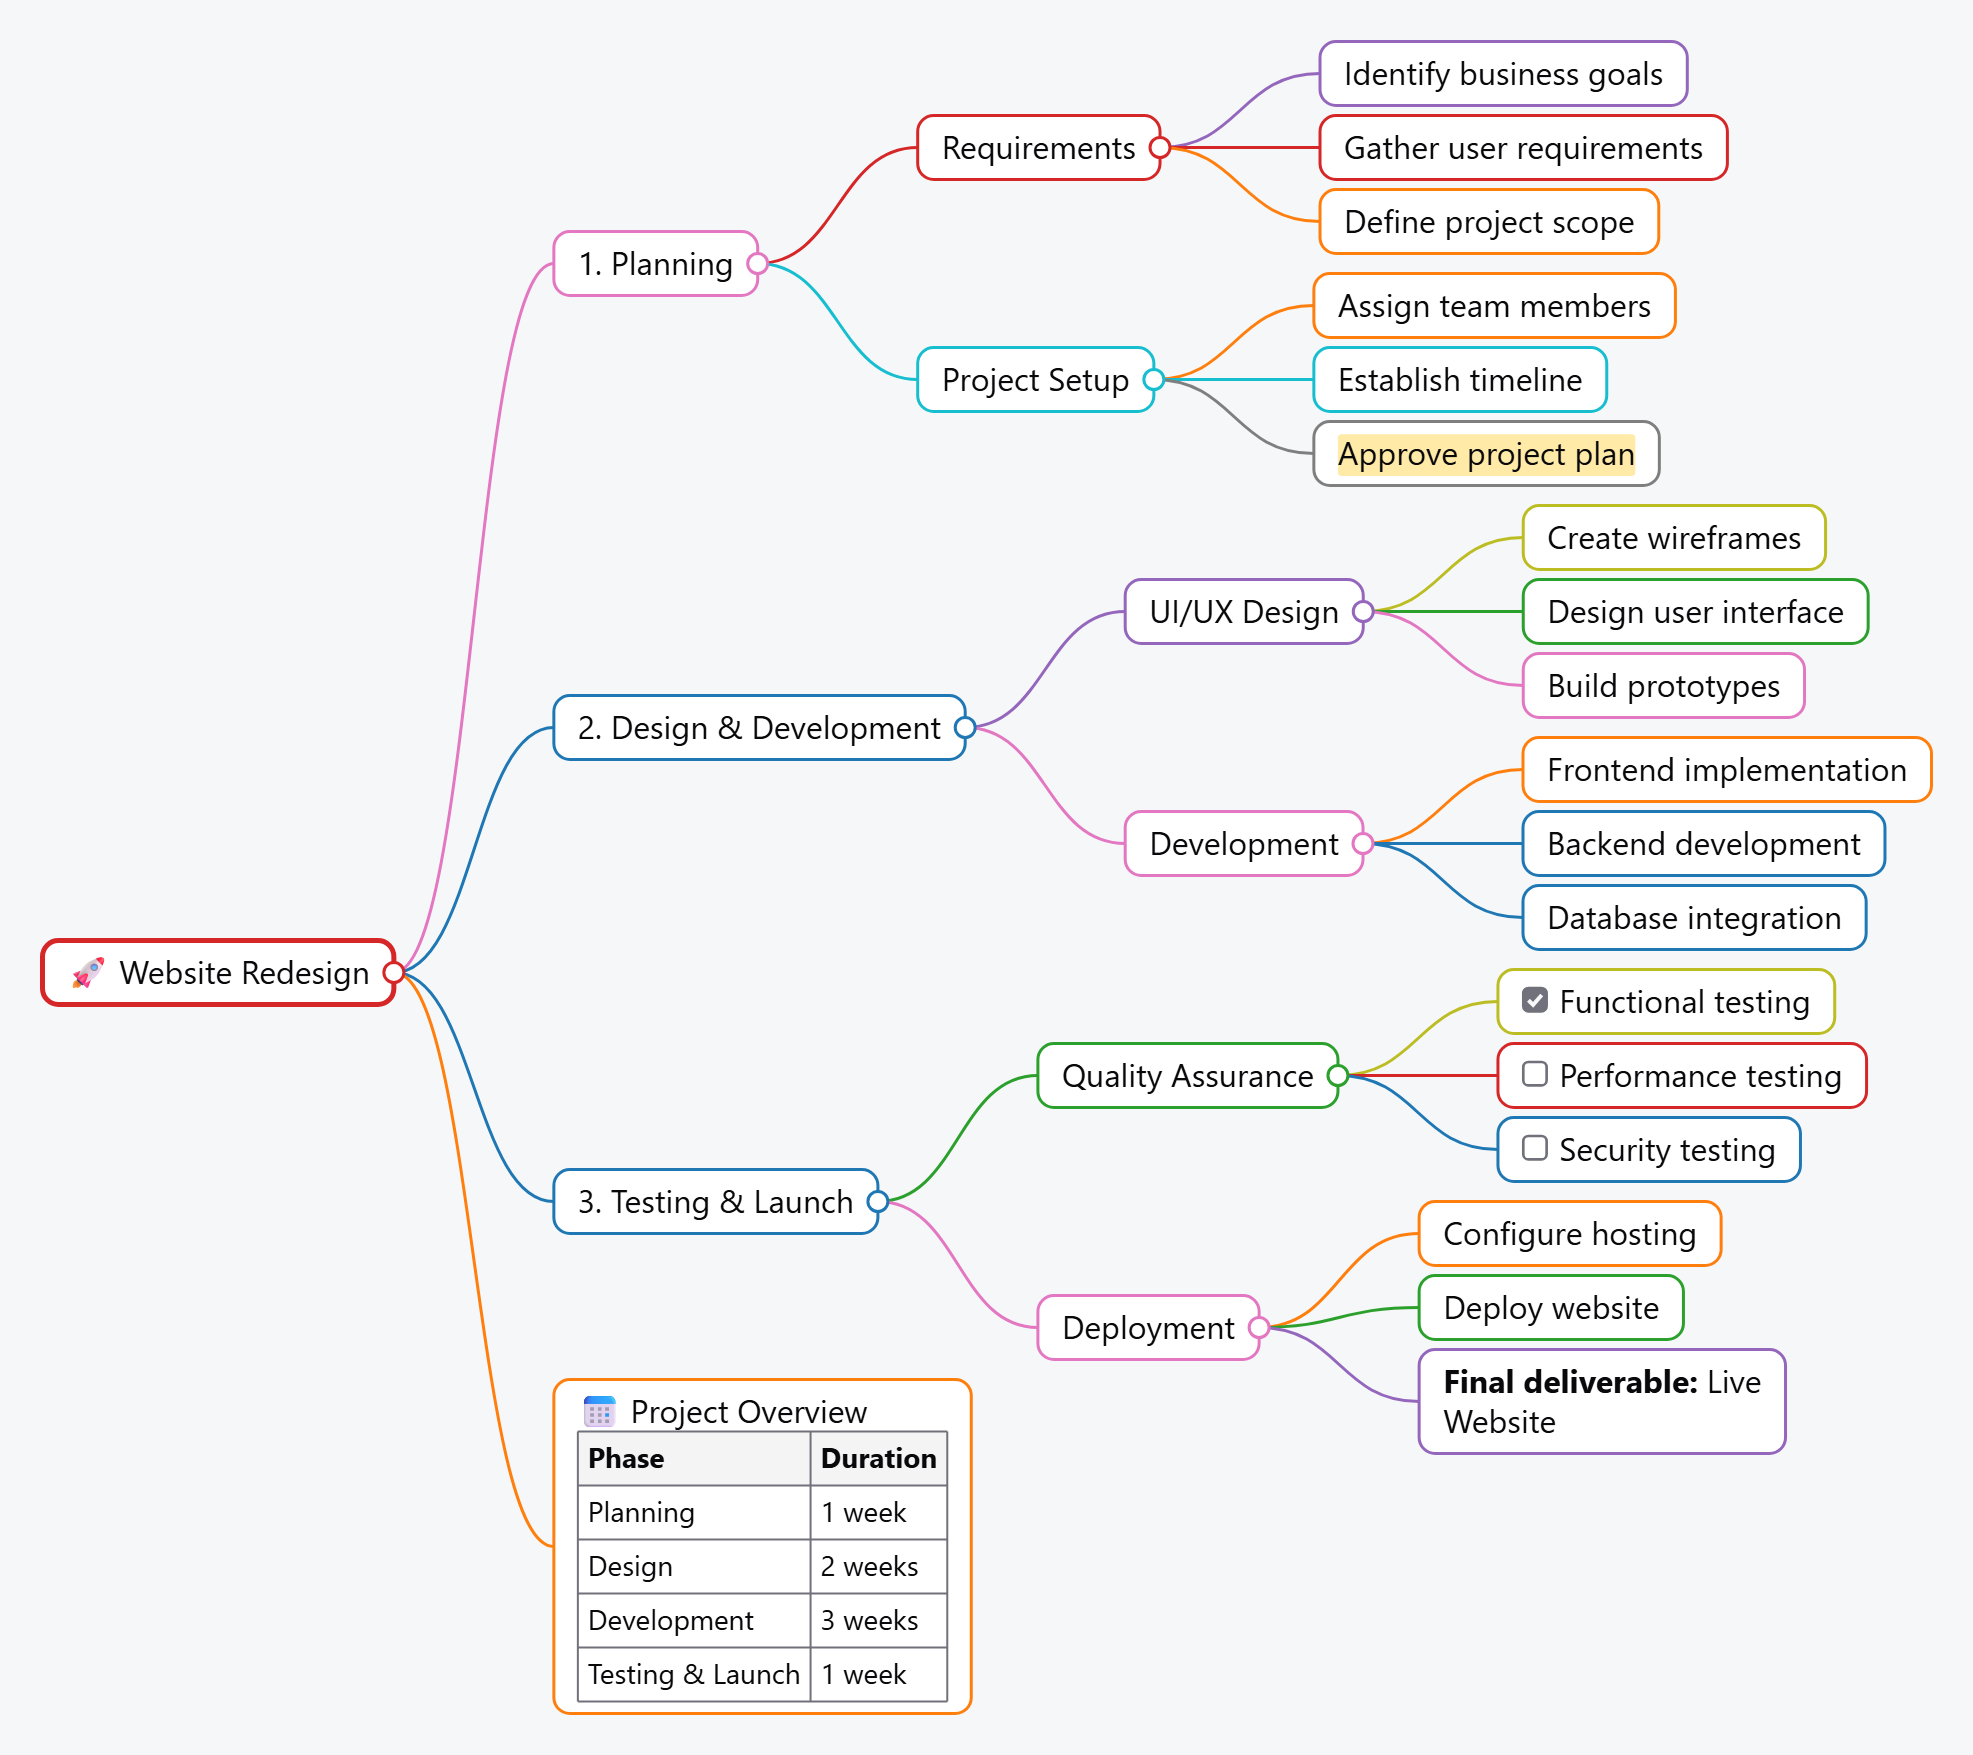
Break a project into phases, activities, and individual tasks using nested Markdown headings and bullet points.
The Cards theme can help distinguish individual project components, while the Tree layout provides a natural way to explore the project hierarchy.
You can also include checklists, tables, highlighted text, and other supported Markdown content to make the mind map more informative.
---
markmap:
  theme: cards
---
# 🚀 Website Redesign

## 1. Planning
### Requirements
- Identify business goals
- Gather user requirements
- Define project scope

### Project Setup
- Assign team members
- Establish timeline
- ==Approve project plan==

## 2. Design & Development
### UI/UX Design
- Create wireframes
- Design user interface
- Build prototypes

### Development
- Frontend implementation
- Backend development
- Database integration

## 3. Testing & Launch
### Quality Assurance
- [x] Functional testing
- [ ] Performance testing
- [ ] Security testing

### Deployment
- Configure hosting
- Deploy website
- **Final deliverable:** Live Website

## 📅 Project Overview
| Phase | Duration |
|---|---:|
| Planning | 1 week |
| Design | 2 weeks |
| Development | 3 weeks |
| Testing & Launch | 1 week |
3. Product Launch Strategies

Organize a product launch into major areas such as product preparation, marketing, sales, and launch activities.
The Two-Sided layout is particularly useful for separating major strategic areas around a central product launch topic.
---
markmap:
  layout: two-sided
  colorDepth: 2
---

# 🚀 Product Launch Strategy

## 🛠️ Product Preparation
### Product Development
- Define core features
- Build MVP
- Conduct beta testing

### Quality & Readiness
- [ ] Functional testing
- [ ] User acceptance
- ==Release approval==

### Documentation
- User guide
- Product FAQ
- [Technical Documentation](https://example.com/docs)

## 📣 Go-to-Market
### Marketing
- Social media campaigns
- Content marketing
- Product demonstrations

### Sales
- Define pricing
- Prepare sales materials
- Train sales team

### Launch Activities
- [ ] Publish announcement
- [ ] Host launch webinar
- [ ] Collect customer feedback
4. Cybersecurity Incident Response Plans
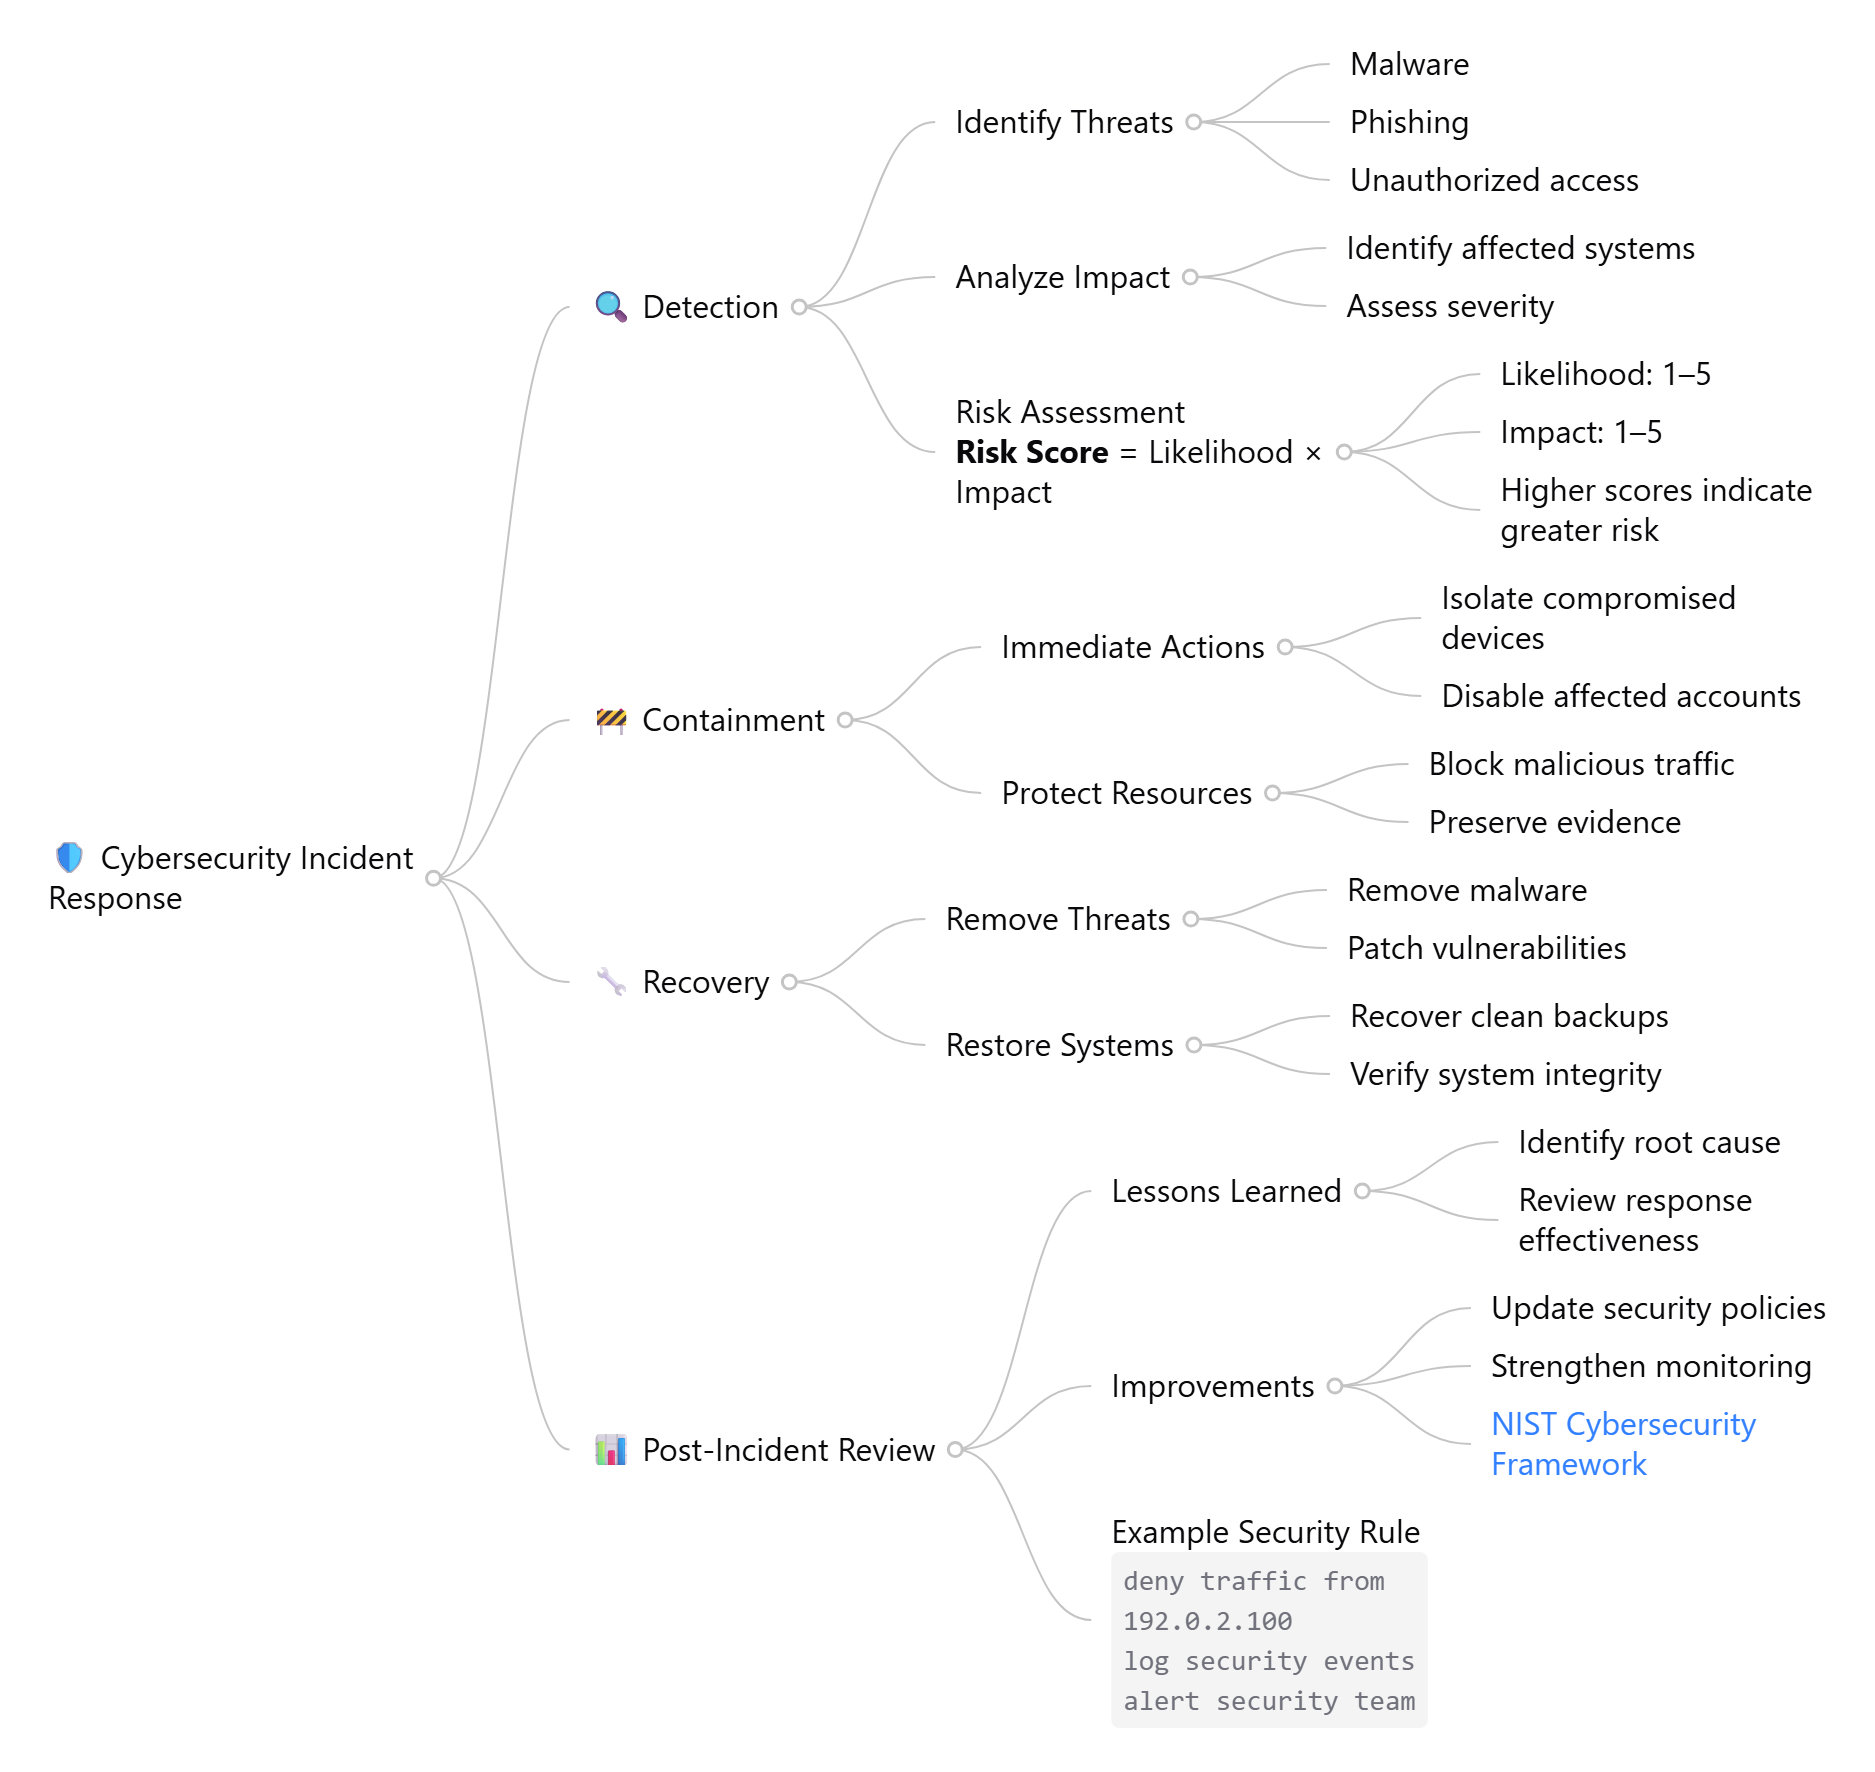
Map out incident detection, containment, recovery, and post-incident review activities.
A hierarchical mind map makes it easier to organize response procedures, supporting actions, and technical considerations into a structured overview.
The Minimal theme can be useful when incorporating the resulting mind map into technical documentation or security reports.
---
markmap:
  colorDepth: 2
  theme: minimal
---

# 🛡️ Cybersecurity Incident Response

## 🔍 Detection
### Identify Threats
- Malware
- Phishing
- Unauthorized access

### Analyze Impact
- Identify affected systems
- Assess severity

### Risk Assessment
**Risk Score** = Likelihood × Impact
- Likelihood: 1–5
- Impact: 1–5
- Higher scores indicate greater risk

## 🚧 Containment
### Immediate Actions
- Isolate compromised devices
- Disable affected accounts

### Protect Resources
- Block malicious traffic
- Preserve evidence

## 🔧 Recovery
### Remove Threats
- Remove malware
- Patch vulnerabilities

### Restore Systems
- Recover clean backups
- Verify system integrity

## 📊 Post-Incident Review
### Lessons Learned
- Identify root cause
- Review response effectiveness

### Improvements
- Update security policies
- Strengthen monitoring
- [NIST Cybersecurity Framework](https://www.nist.gov/cyberframework)

### Example Security Rule
    deny traffic from 192.0.2.100
    log security events
    alert security team
5. Decision Trees
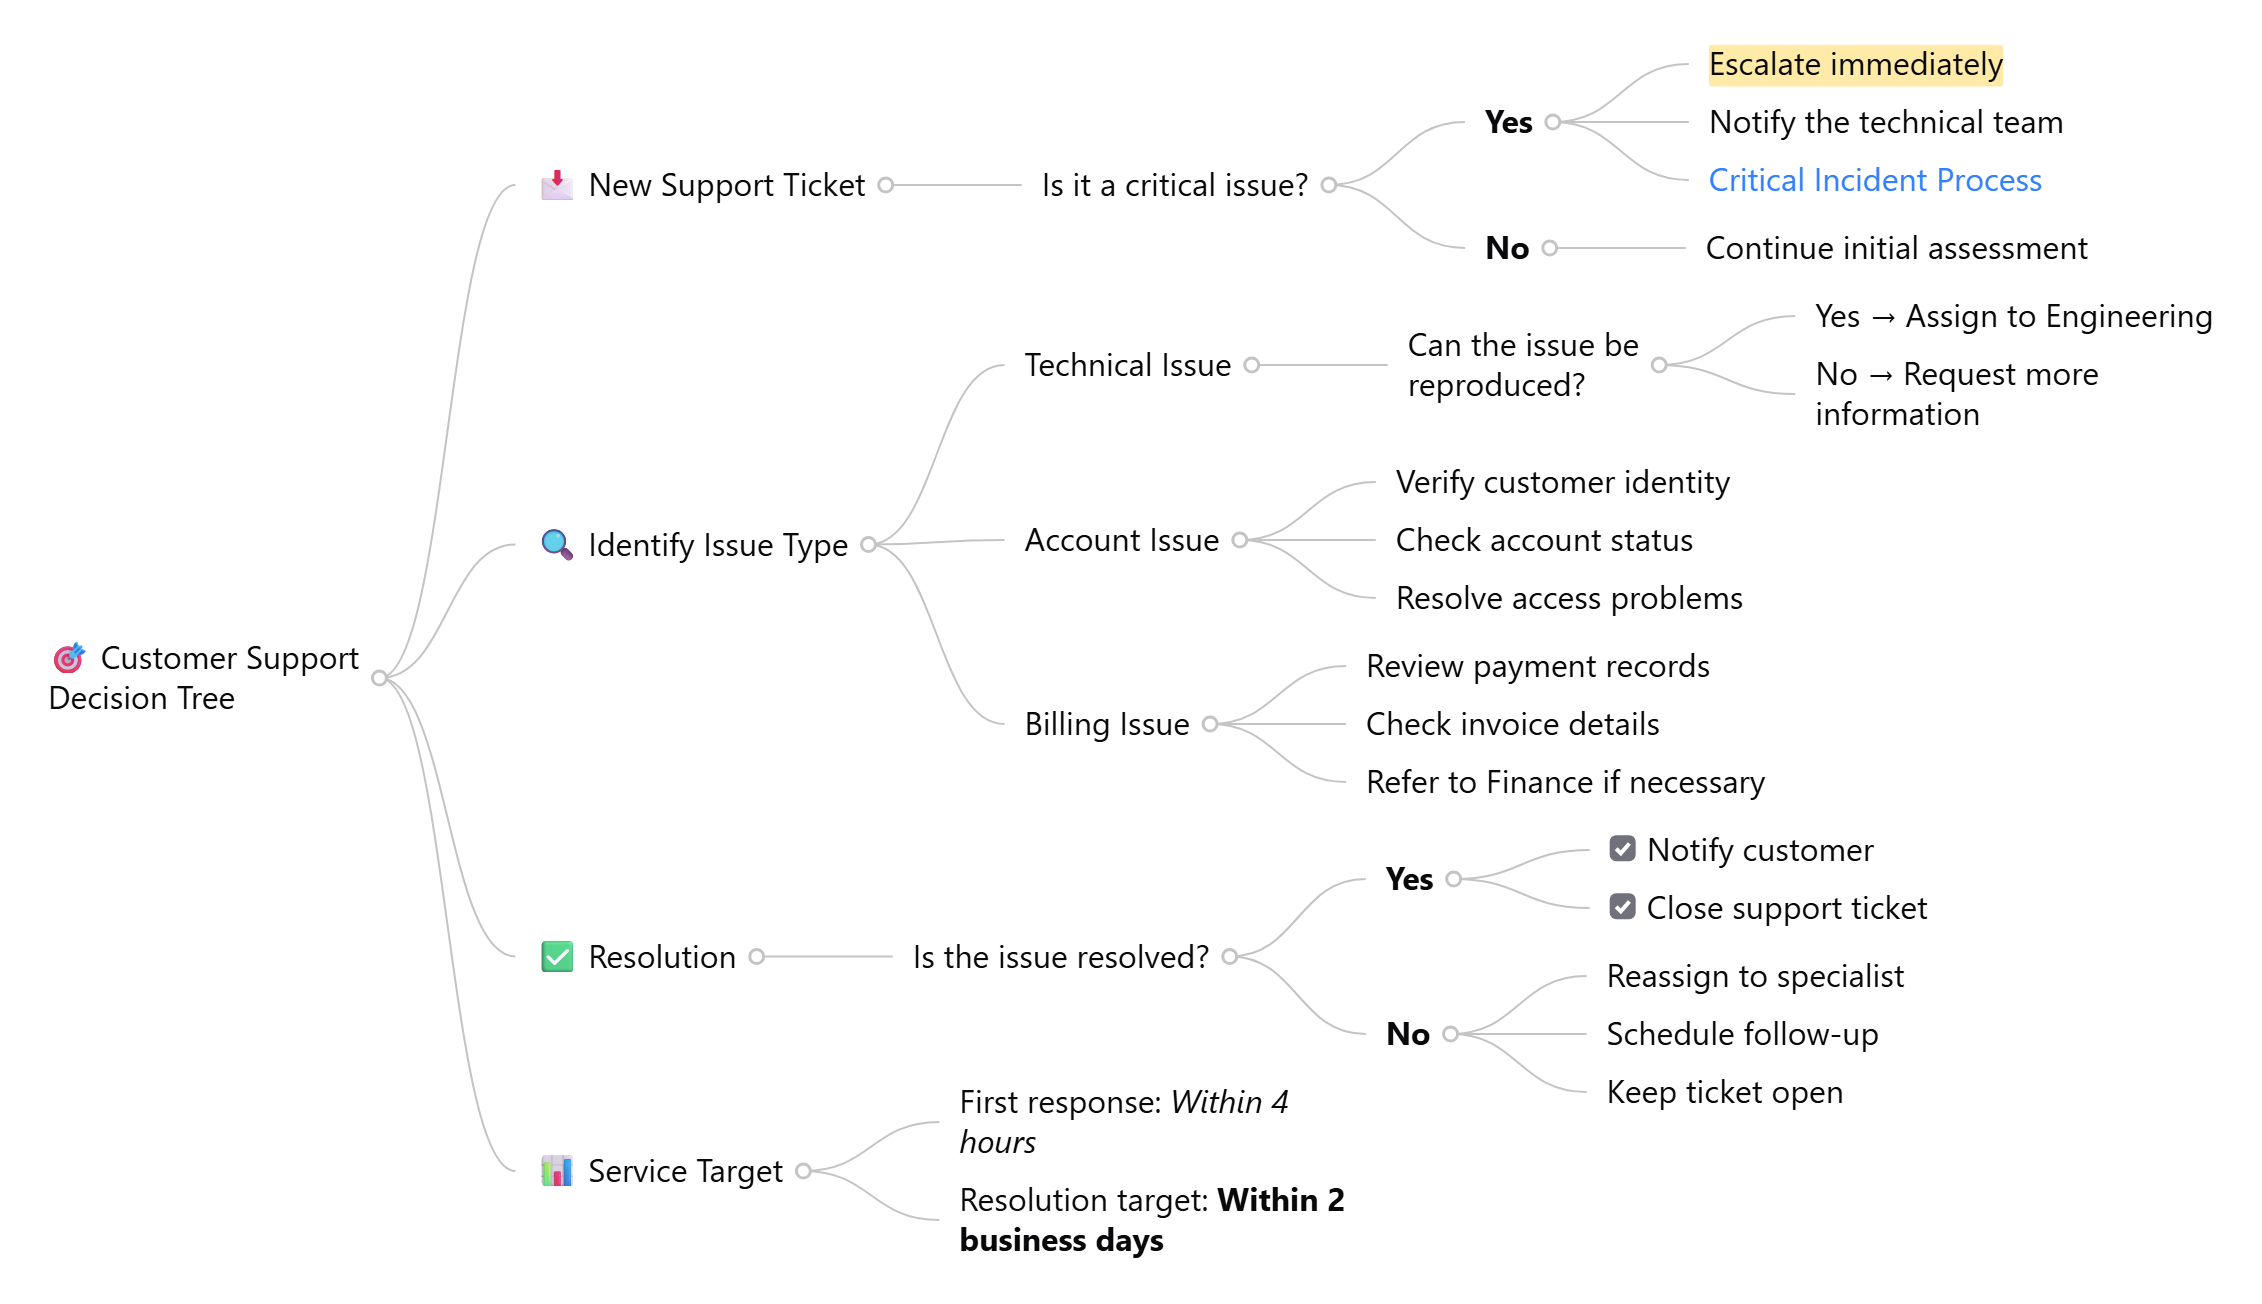
Represent decision-making processes using nested questions, possible outcomes, and corresponding actions.
For example, a customer support decision tree can organize ticket classification, issue assessment, escalation, and resolution procedures.
With the appropriate hierarchy and styling, a Markdown-based decision tree becomes easier to review and communicate.
---
markmap:
  colorDepth: 2
  theme: minimal
---

# 🎯 Customer Support Decision Tree

## 📩 New Support Ticket
### Is it a critical issue?
- **Yes**
  - ==Escalate immediately==
  - Notify the technical team
  - [Critical Incident Process](https://example.com/incidents)
- **No**
  - Continue initial assessment

## 🔍 Identify Issue Type
### Technical Issue
- Can the issue be reproduced?
  - Yes → Assign to Engineering
  - No → Request more information

### Account Issue
- Verify customer identity
- Check account status
- Resolve access problems

### Billing Issue
- Review payment records
- Check invoice details
- Refer to Finance if necessary

## ✅ Resolution
### Is the issue resolved?
- **Yes**
  - [x] Notify customer
  - [x] Close support ticket
- **No**
  - Reassign to specialist
  - Schedule follow-up
  - Keep ticket open

## 📊 Service Target
- First response: *Within 4 hours*
- Resolution target: **Within 2 business days**
6. Root Cause Analysis
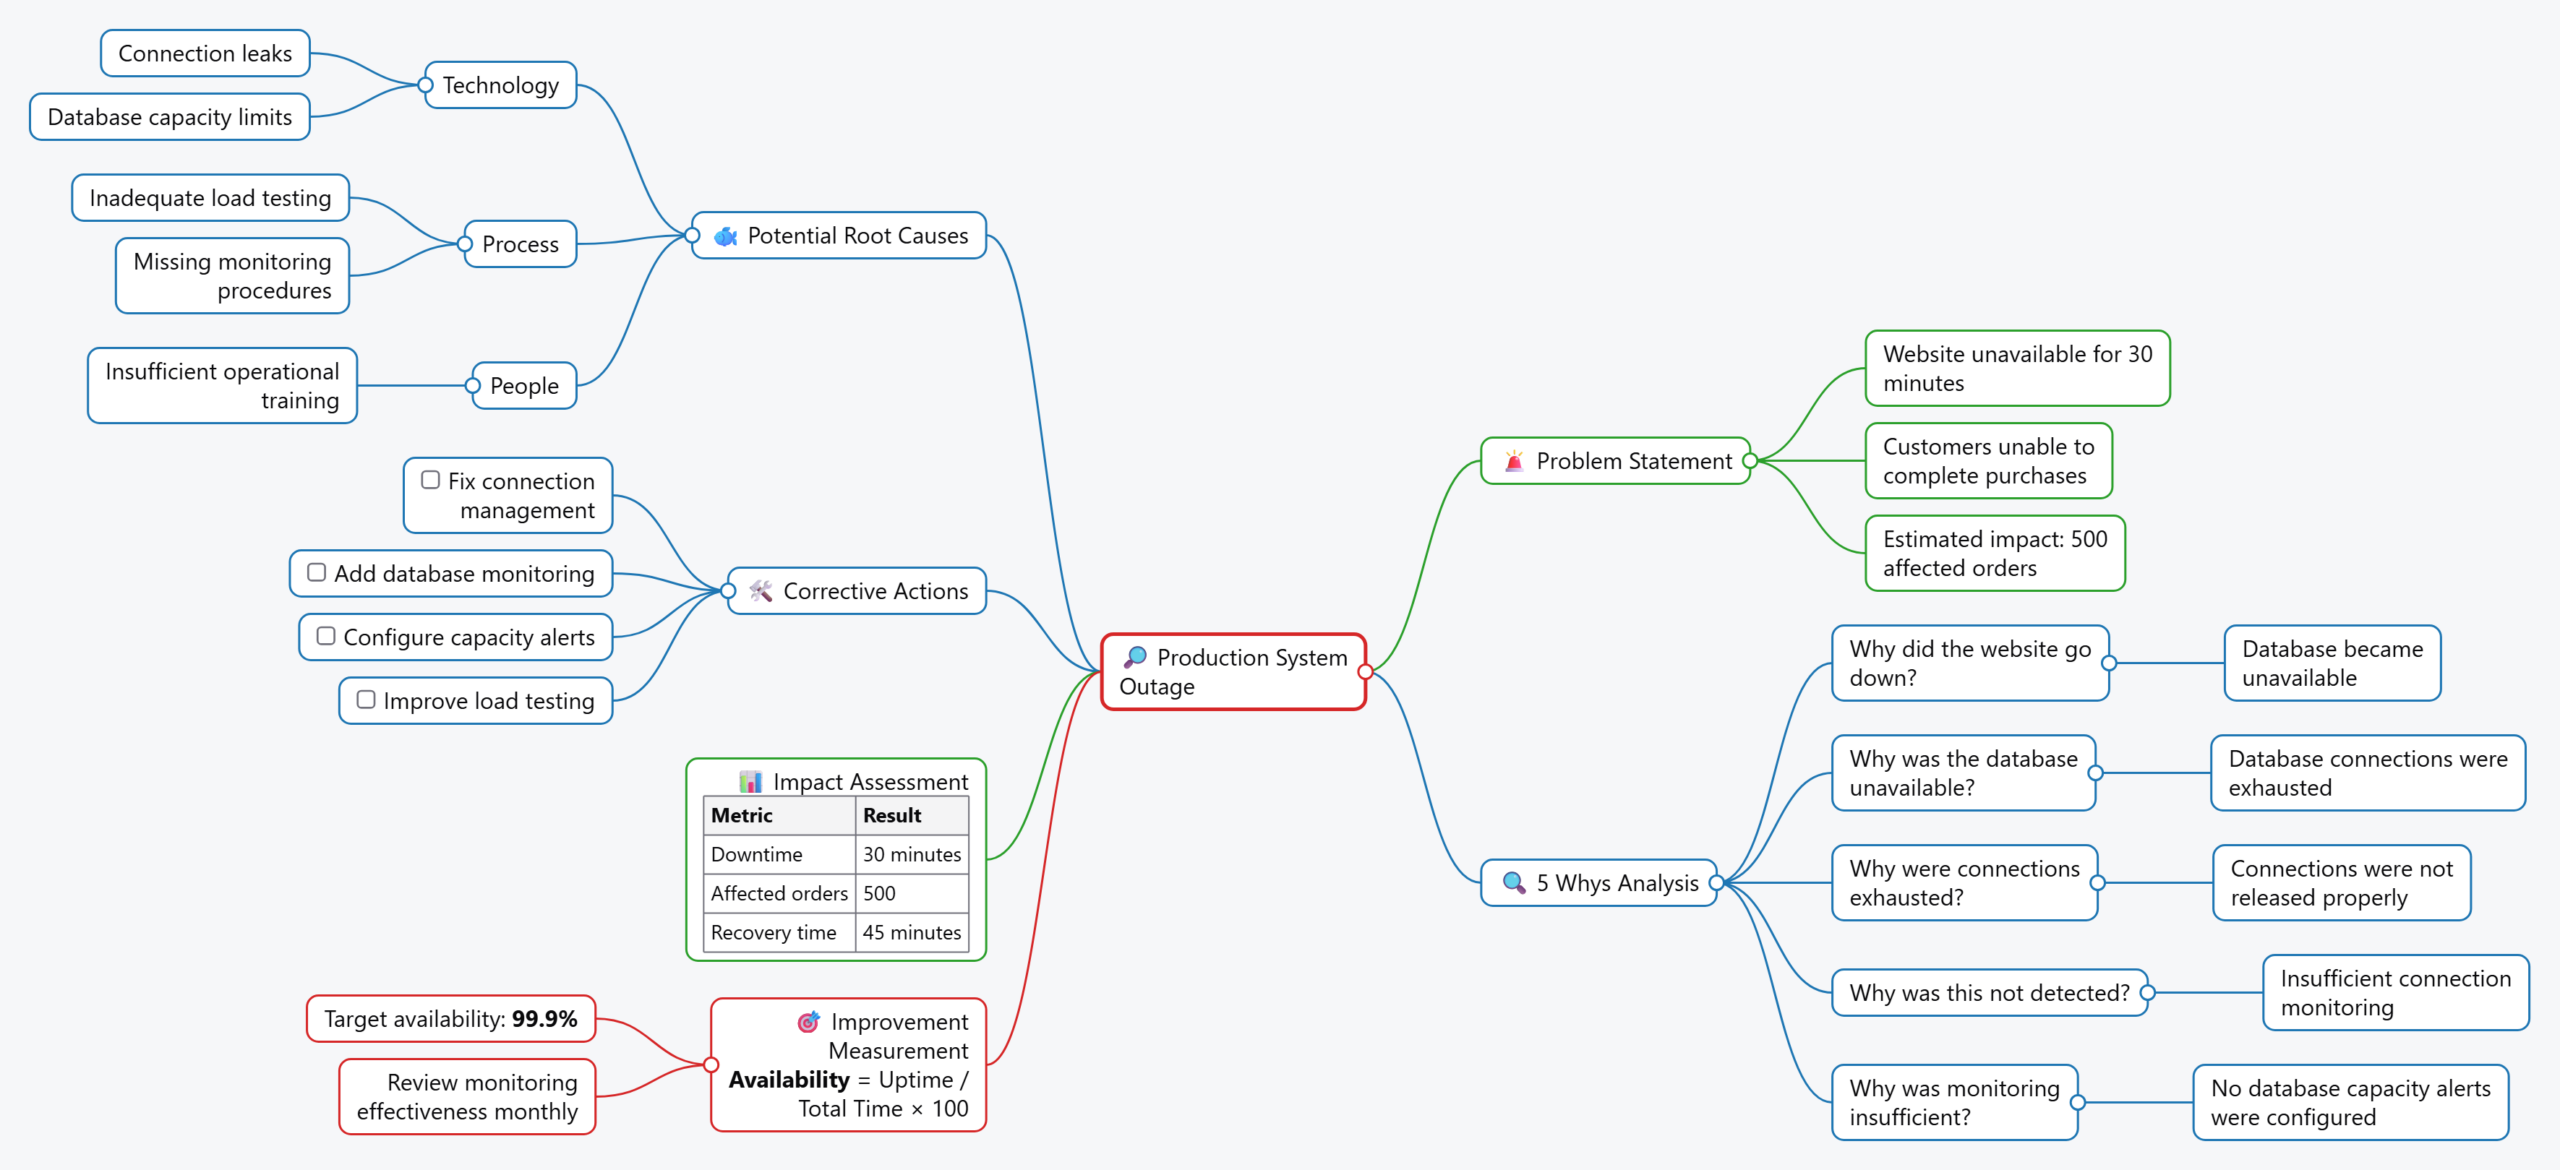
Organize a problem investigation into a problem statement, contributing factors, potential root causes, and corrective actions.
You can use a Two-Sided layout to separate different areas of investigation or a Tree layout to present a structured sequence of analysis.
For example, a production system outage investigation could include a Five Whys analysis, technology-related causes, process-related causes, and corrective actions in one mind map.
---
markmap:
  colorDepth: 2
  theme: cards
  layout: two-sided
  color:
    - '#1f77b4'
    - '#ff7f0e'
    - '#2ca02c'
    - '#d62728'
    - '#9467bd'
  siblingGap: 12
---

# 🔎 Production System Outage

## 🚨 Problem Statement
- Website unavailable for 30 minutes
- Customers unable to complete purchases
- Estimated impact: 500 affected orders

## 🔍 5 Whys Analysis
### Why did the website go down?
- Database became unavailable

### Why was the database unavailable?
- Database connections were exhausted

### Why were connections exhausted?
- Connections were not released properly

### Why was this not detected?
- Insufficient connection monitoring

### Why was monitoring insufficient?
- No database capacity alerts were configured

## 🐟 Potential Root Causes
### Technology
- Connection leaks
- Database capacity limits

### Process
- Inadequate load testing
- Missing monitoring procedures

### People
- Insufficient operational training

## 🛠️ Corrective Actions
- [ ] Fix connection management
- [ ] Add database monitoring
- [ ] Configure capacity alerts
- [ ] Improve load testing

## 📊 Impact Assessment

| Metric | Result |
|---|---:|
| Downtime | 30 minutes |
| Affected orders | 500 |
| Recovery time | 45 minutes |

## 🎯 Improvement Measurement
**Availability** = Uptime / Total Time × 100

- Target availability: **99.9%**
- Review monitoring effectiveness monthly
Go Beyond Mind Mapping: Markmap in the VPasCode Ecosystem
Although this enhancement focuses on Markmap, it is worth understanding the broader role of VPasCode within the Visual Paradigm ecosystem.
VPasCode is not a standalone Markmap generator. It is a unified, browser-based diagram-as-code environment that supports multiple text-based diagramming and visualization formats.
Depending on your needs, you can work with:
- PlantUML: Create UML diagrams, software architecture diagrams, sequence diagrams, class diagrams, and other technical models.
- Mermaid: Generate flowcharts, sequence diagrams, mind maps, timelines, and other visualizations using text.
- Graphviz: Create graph-based visualizations, directed graphs, and organizational structures.
- D2: Describe and visualize systems, relationships, and architecture using a declarative diagramming language.
- ECharts: Build data visualizations such as bar charts, line charts, pie charts, and other interactive charts.
- Markmap: Transform Markdown outlines into interactive hierarchical mind maps.
This multi-format approach means you do not have to switch between separate online tools whenever your visualization requirements change.
You can also incorporate VPasCode into a broader content workflow. For example, create or refine a mind map, export it as an image for sharing, or pass it to Visual Paradigm OpenDocs for inclusion in project documentation.
For teams that need to communicate ideas, document systems, or maintain project knowledge, this provides a convenient connection between text-based diagram creation and documentation.
Start Creating Better-Looking Mind Maps Today
The enhanced Markmap editor brings more visual flexibility to Markdown-based mind mapping in VPasCode.
With three themes, three layout options, and additional styling controls, you can adapt the same underlying Markdown content to different communication needs. Whether you prefer the traditional look of Classic, the structured presentation of Cards, or the simplicity of Minimal, you have more control over how your ideas are presented.
Combined with real-time rendering and VPasCode’s support for multiple diagram-as-code formats, the enhancement makes it easier to move from a simple text outline to a polished, shareable visual representation.
Ready to explore the new Markmap customization options?
Open VPasCode and Try the Enhanced Markmap Editor →
To learn more about VPasCode and its diagram-as-code capabilities, visit the Visual Paradigm VPasCode feature page.
Frequently Asked Questions (FAQ)
What is Markmap?
Markmap is a Markdown-to-mind-map tool that converts structured Markdown content into interactive hierarchical visualizations. It allows users to create mind maps using headings and nested lists instead of manually drawing nodes and connections.
What is VPasCode?
VPasCode is Visual Paradigm’s browser-based diagram-as-code platform. It allows users to create, edit, and visualize diagrams using text-based formats such as PlantUML, Mermaid, Graphviz, D2, and Markmap, among others.
Can I create mind maps from Markdown in VPasCode?
Yes. VPasCode supports Markmap, allowing you to write or edit Markdown content and see it rendered as an interactive mind map. You can organize information using headings and nested bullet points.
What themes are available in the enhanced Markmap editor?
The enhanced Markmap editor provides three themes: Classic, Cards, and Minimal. Classic uses colorful curved branches, Cards places node content inside bordered boxes, and Minimal provides a cleaner appearance with thinner connections and reduced visual decoration.
What layouts does the VPasCode Markmap editor support?
There are three layout options: Tree, Two-Sided, and Org Chart. Tree presents the traditional right-growing mind map structure, Two-Sided distributes branches on both sides of the root, and Org Chart arranges information in a top-down hierarchy.
Can I customize Markmap colors and spacing?
Yes. You can choose between Per Node, Per Branch, and Single Color modes, select a color palette, and adjust the Wrap Width, Level Spacing, and Sibling Spacing settings to refine the visual presentation.
Do I need to modify Markdown code to change the Markmap appearance?
No. The enhanced VPasCode editor provides dropdown menus for theme, layout, and styling options. You can change these settings directly in the interface, and the mind map is re-rendered automatically.
Can I use Markmap for organizational charts?
Yes. The Org Chart layout is designed for top-down hierarchical structures, making it suitable for company organizational charts, department structures, management hierarchies, and reporting relationships. The Cards theme can further enhance the structured appearance.
Can I use Markmap for project planning?
Yes. You can use Markdown headings and nested lists to organize project phases, activities, and tasks. Markmap can visualize this information as a hierarchical project plan or work breakdown structure.
Is VPasCode only a Markmap editor?
No. Markmap is one of several supported formats. VPasCode also supports PlantUML, Mermaid, Graphviz, D2, ECharts, and other text-based diagramming and visualization technologies, making it a unified diagram-as-code workspace.
Can I share or export my Markmap diagrams?
VPasCode supports sharing and exporting diagram visualizations. You can use the resulting visuals in presentations, reports, and other documentation workflows. You can also send supported content to Visual Paradigm OpenDocs for documentation.