
We have rolled out a new set of enhancements to the Visual Paradigm AI Infographic Maker to help you turn ideas and data into clean visuals faster. You can now open any template in a single click, generate content directly inside the editor, and switch layouts with predictable, well-structured results.
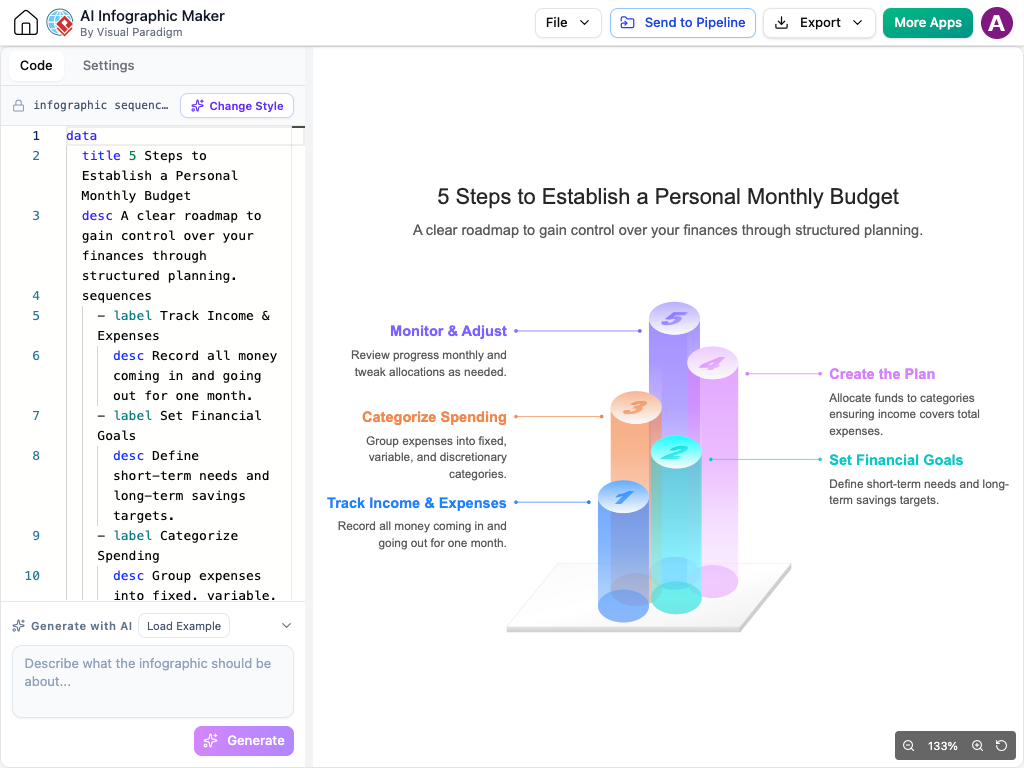
What’s Enhanced in the Infographic Editor
- One-Click Template Opening: Click any template on the index page to open it directly in the editor, ready for immediate customization.
- Inline AI Generation: Access the AI prompt box directly in the bottom-left panel of the editor. Enter your topic, click Generate, and watch your infographic update live on the canvas to the right.
- Tailored, Concise Sample Prompts: Every template includes its own short, customized sample prompt tailored to its specific visual structure—giving you clear, practical ideas of what each layout can achieve.
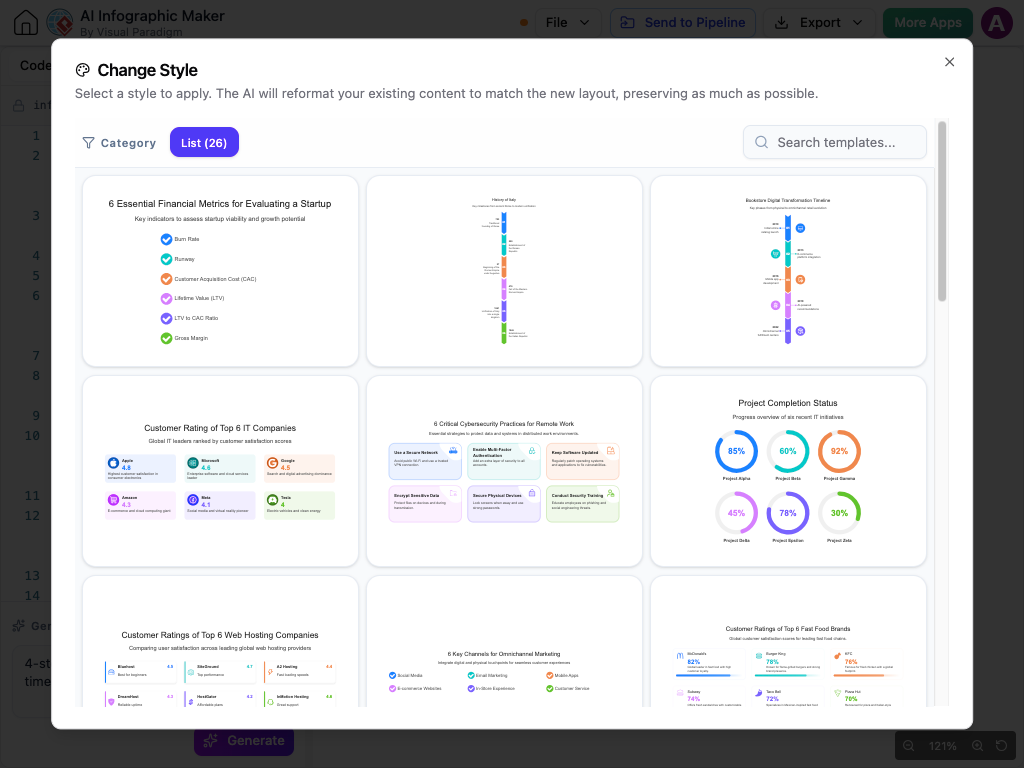
- Smarter “Change Style” Layout Filtering: Use Change Style in the toolbar to browse only the layouts compatible with your current infographic structure, keeping your formatting intact when experimenting with new designs.
- More Accurate AI Content & Data: Our enhanced AI engine generates titles, descriptions, and chart figures that match your prompt more closely, delivering realistic, cohesive content right out of the box.
- Clear Item Limits: When adding items to a section, the editor displays the exact maximum item limit so you can easily keep your content within bounds.
In Practice: From Prompt to Polished Visual
Imagine you are preparing a quarterly review and want to visualize customer onboarding milestones. With these enhancements, you can build the graphic in seconds:
- Click a timeline or process template from the gallery to open it directly on the editing canvas.
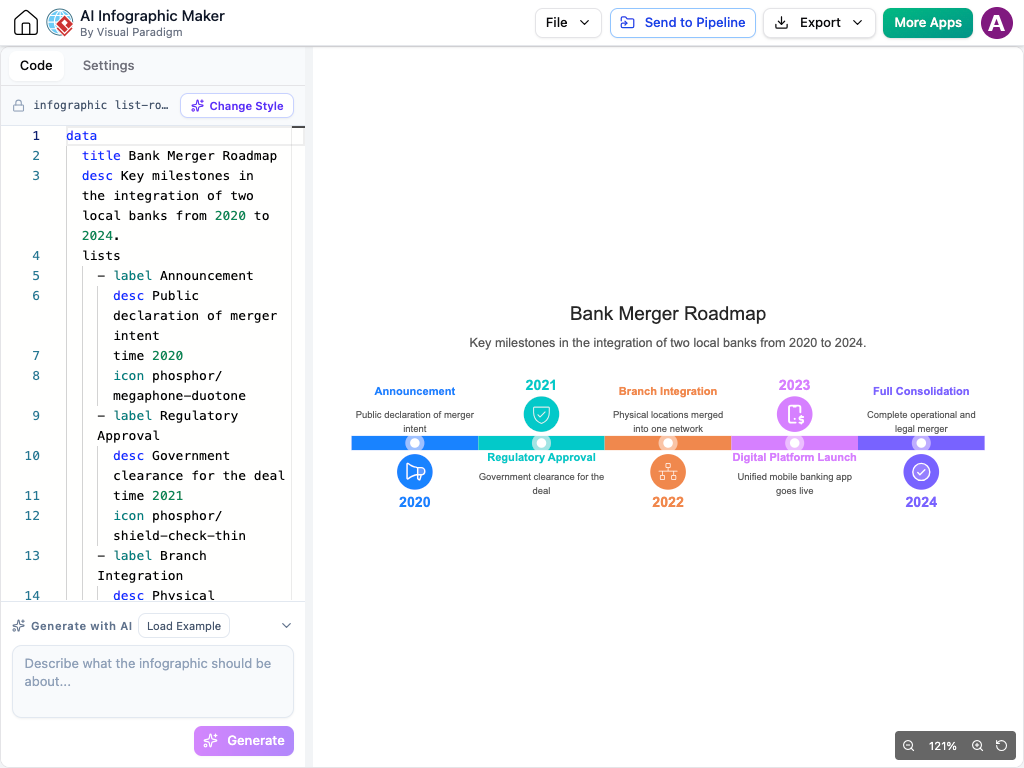
- In the bottom-left prompt box, try the template’s sample prompt to see how the structure handles milestone data, then replace it with your own: “4-step SaaS customer onboarding timeline from signup to first value.”
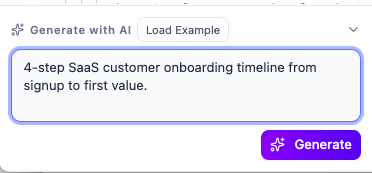
- Click Generate, and the canvas immediately populates with relevant step titles, concise descriptions, and realistic timeframes.
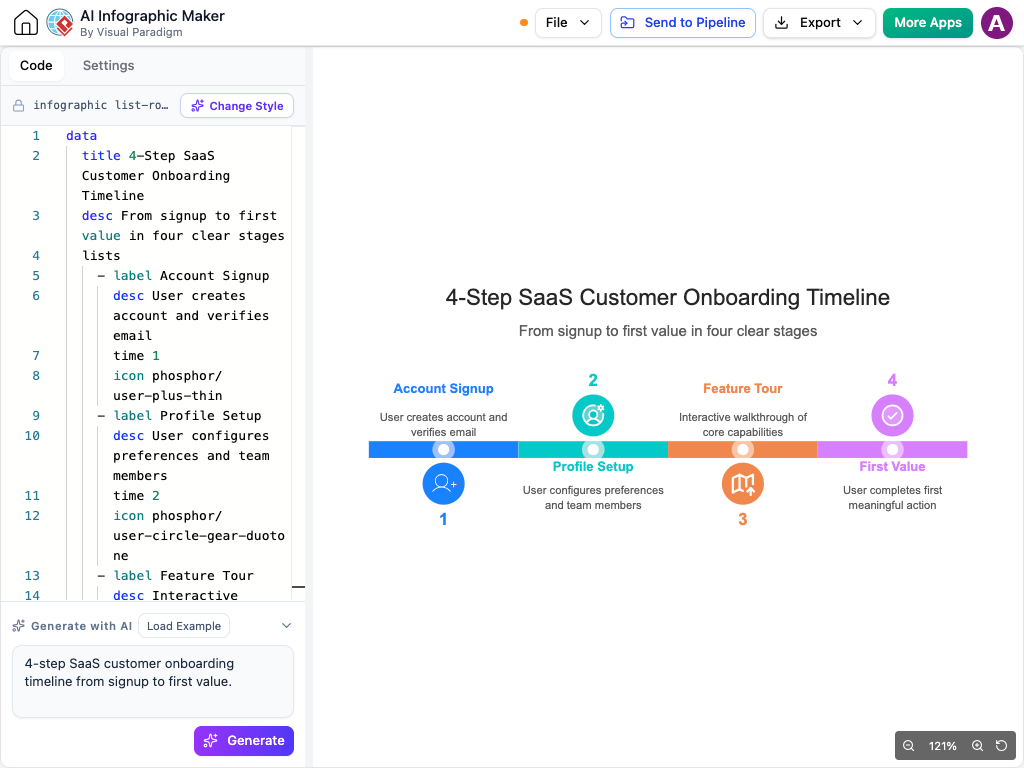
- Click Change Style to explore compatible layouts while keeping your 4-step structure intact.
Why Use the Enhanced Infographic Workflow?
- Uninterrupted Editing: Keep your eyes on the canvas while refining AI prompts in the bottom-left panel, making rapid iterations effortless.
- Predictable Design Switching: Test different visual styles confidently without worrying about text overlapping or charts breaking.
- Instant Inspiration: Short, template-specific sample prompts show you exactly what kind of data works best for each visual format.
- Less Manual Cleanup: More accurate AI-generated chart numbers and descriptions mean less time spent rewriting placeholder text.
How to Get Started
- Go to the Infographic Templates index page in your Visual Paradigm workspace.
- Click any template to launch it directly in the editor.
- To edit manually, click any text block or chart element on the canvas.
- To generate content with AI, enter your topic (or pick a sample prompt) in the bottom-left panel and click Generate.
- Review the live output on the right, and click Change Style in the toolbar anytime you want to try a compatible layout.
Part of Your Connected Visual Workspace
Once your infographic is ready, it fits seamlessly into the broader Visual Paradigm ecosystem. You can embed your finished visuals directly into OpenDocs reports, include them in collaborative project workspaces, or export high-resolution graphics for presentations and web content.
Ready to turn your ideas and data into clean visuals? Open the Visual Paradigm Infographic Maker today and try out the latest enhancements.