
Centralizing team documentation involves more than just storing meeting minutes and project files—it requires making complex information instantly digestible. Visual Paradigm NotesKeep now enables teams to embed editable, AI-generated infographics directly into workspace pages, seamlessly uniting written notes, technical documentation, and visual diagrams in one central source of truth.
Powered by the Visual Paradigm Infographic Maker, NotesKeep provides instant access to more than 200 professional visual formats. Whether mapping out system architectures, comparing product options, or tracking agile project milestones, users can either customize structured templates or leverage an intelligent AI diagram generator to build visuals straight from raw text notes.
Explore NotesKeep Workspaces →
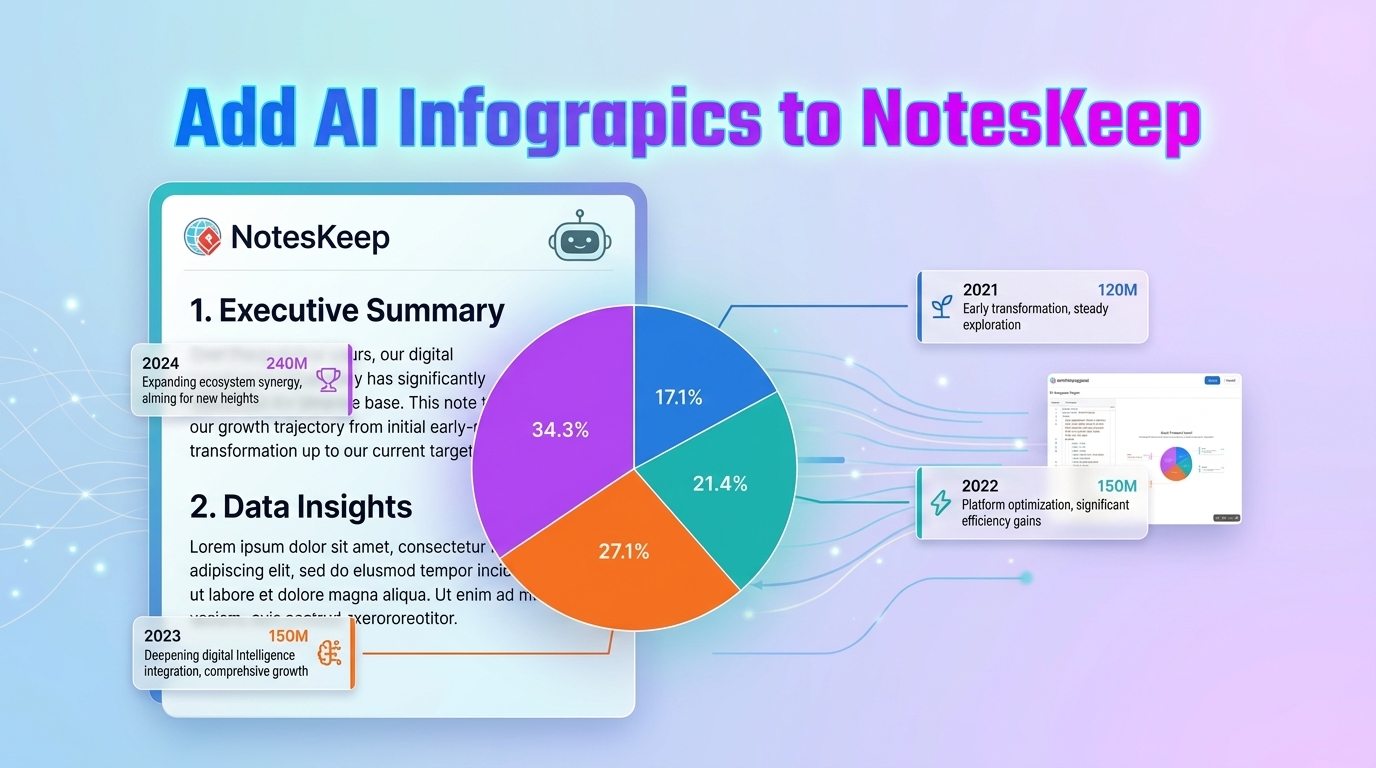
Make Team Documentation Clearer and More Engaging
Complex workflows and technical concepts are notoriously difficult to explain through text alone. While detailed meeting logs and project briefs capture the necessary details, an online diagram generator allows teams to communicate system dependencies, product roadmaps, and strategic plans at a single glance.
Embedding infographics directly inside your workspace notes eliminates the need to switch between separate design applications or navigate away from your documentation. By placing visual explanations right alongside related prose, your team wiki, technical specs, and onboarding repositories become significantly easier to scan, comprehend, and maintain.
For engineering and product teams relying on NotesKeep as their primary knowledge management tool, this integration bridges the gap between unstructured notes and structured visual modeling. Written insights and interactive graphics live harmoniously within a single AI knowledge base.
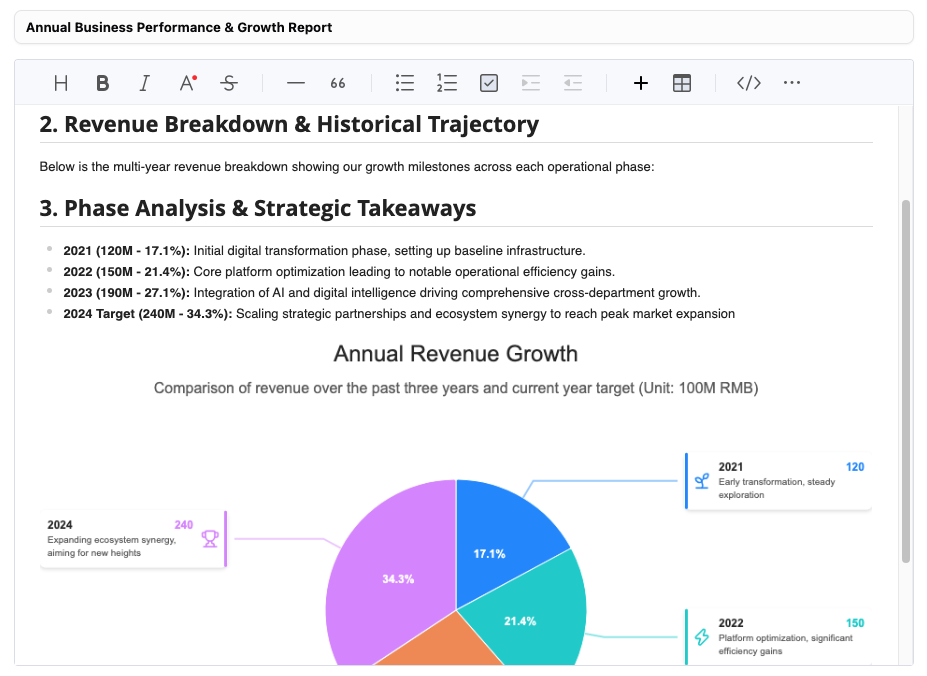
From Raw Notes to Dynamic Visuals in Minutes
Building impactful graphics for your workspaces requires zero design experience and minimal effort:
- Extensive Template Library: Choose from over 200 layouts tailored for process flows, organizational charts, comparison grids, timelines, and quantitative charts.
- Smart AI Generation: Paste a project summary or type a descriptive prompt, and the built-in AI diagram generator will instantly draft a customized visual foundation.
- Full Editability: Keep your content adaptable. Tweak text copy, rearrange layout nodes, update icon sets, or adjust underlying code directly within the integrated editor.
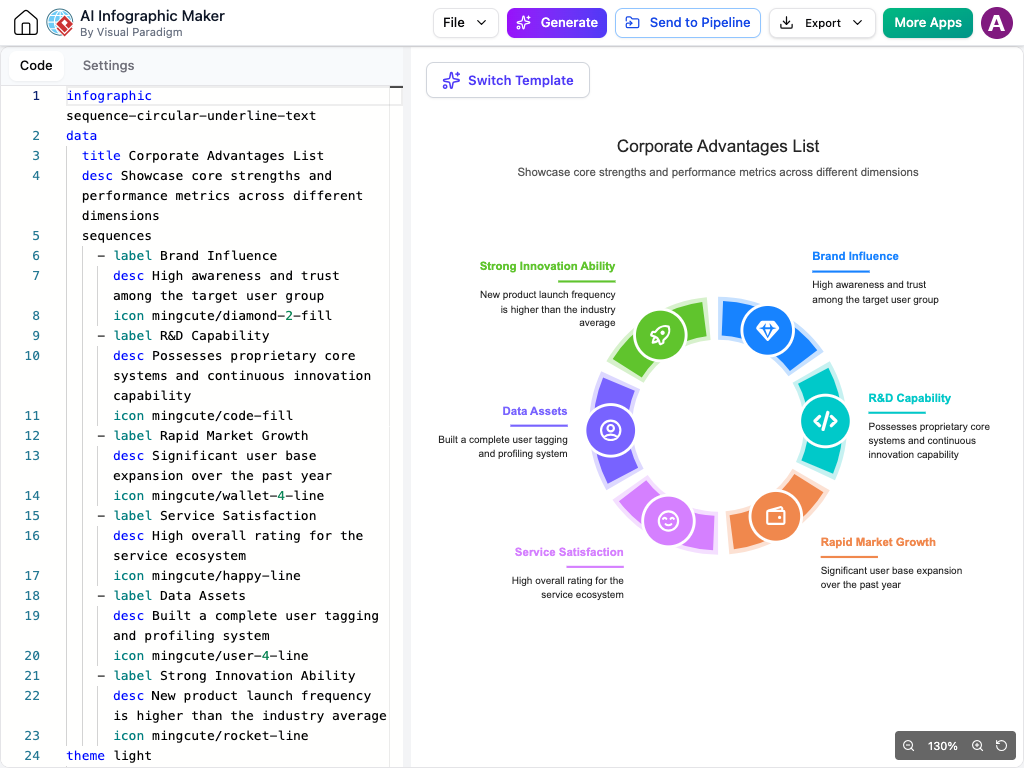
Core Benefits for Knowledge Management Teams
- Unified Context: Keep visual aids locked directly to the paragraphs and notes they support.
- Accelerated Creation: Transform dense meeting transcripts and feature specs into polished graphics with a simple prompt.
- Complete Customization: Tailor colors, text, and structure after generation to align with your organization’s documentation standards.
- Seamless Updates: Modify embedded graphics instantly as project requirements evolve without breaking your page layout.
How to Insert an Infographic in Your NotesKeep Workspace
- Log into Visual Paradigm NotesKeep and open your target workspace page.
- Click on any notes which you would like to add an infographic to
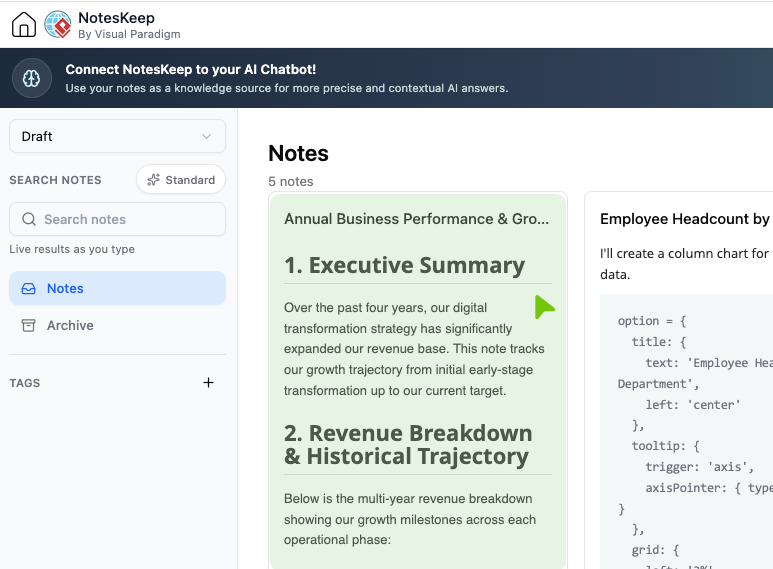
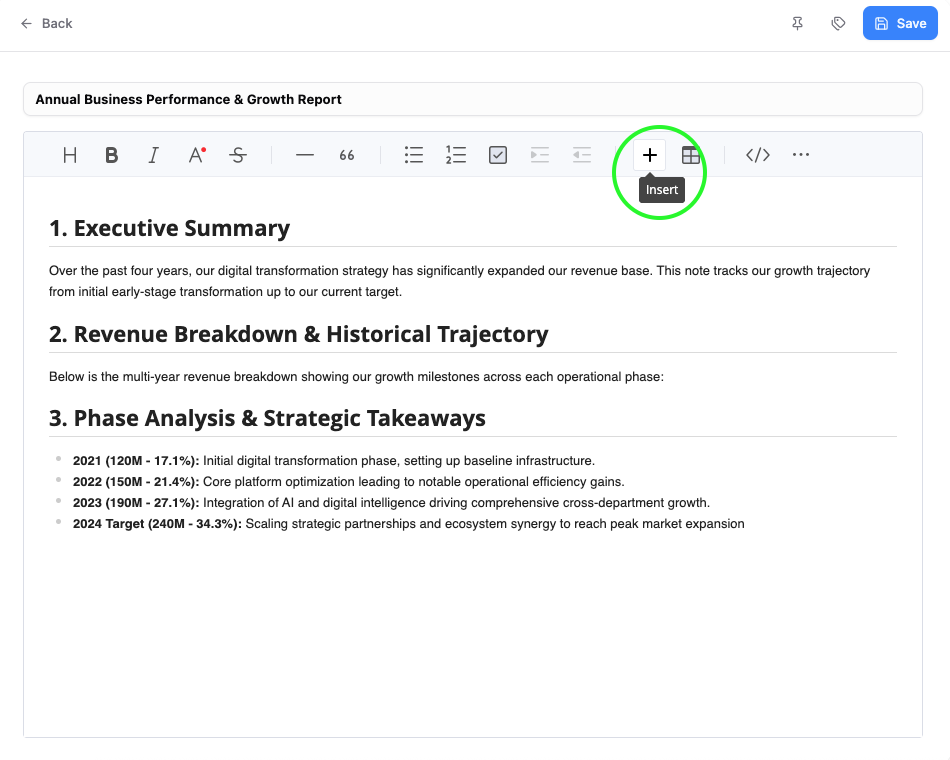
- Click the + toolbar icon to launch the artifact creation menu.
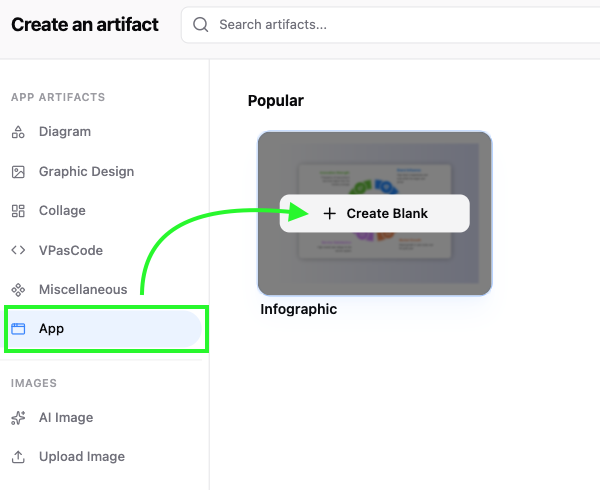
- Select App, then choose the Infographic option.
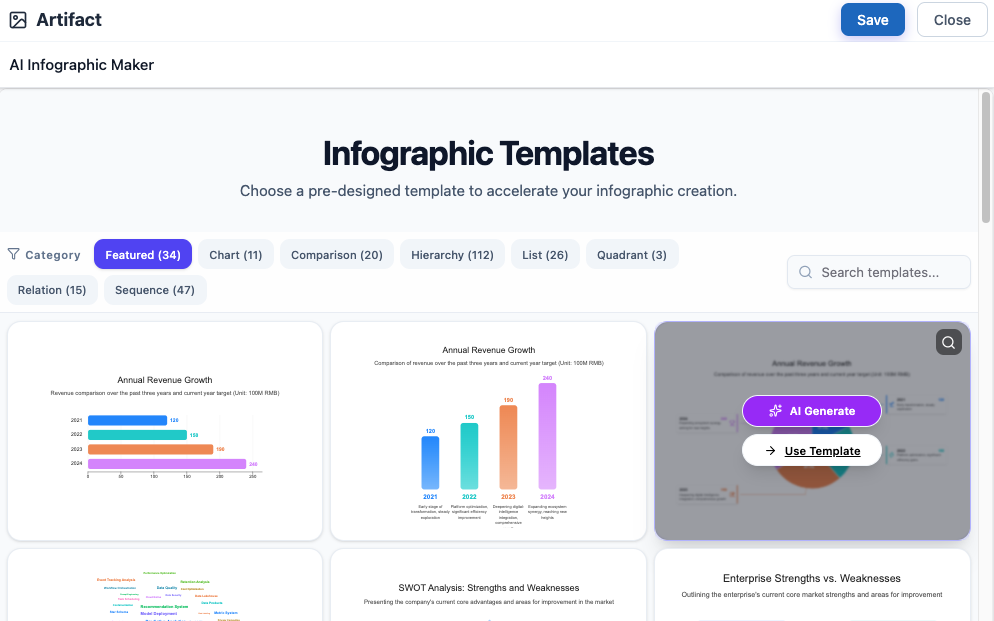
- Choose your preferred creation method:
- Template Selection: Pick an infographic type and click Use Template to begin editing manually.
- AI Prompting: Select an infographic style, click AI Generation, enter your topic description, and generate your draft.
- Refine your text, data and styling inside the editor interface.
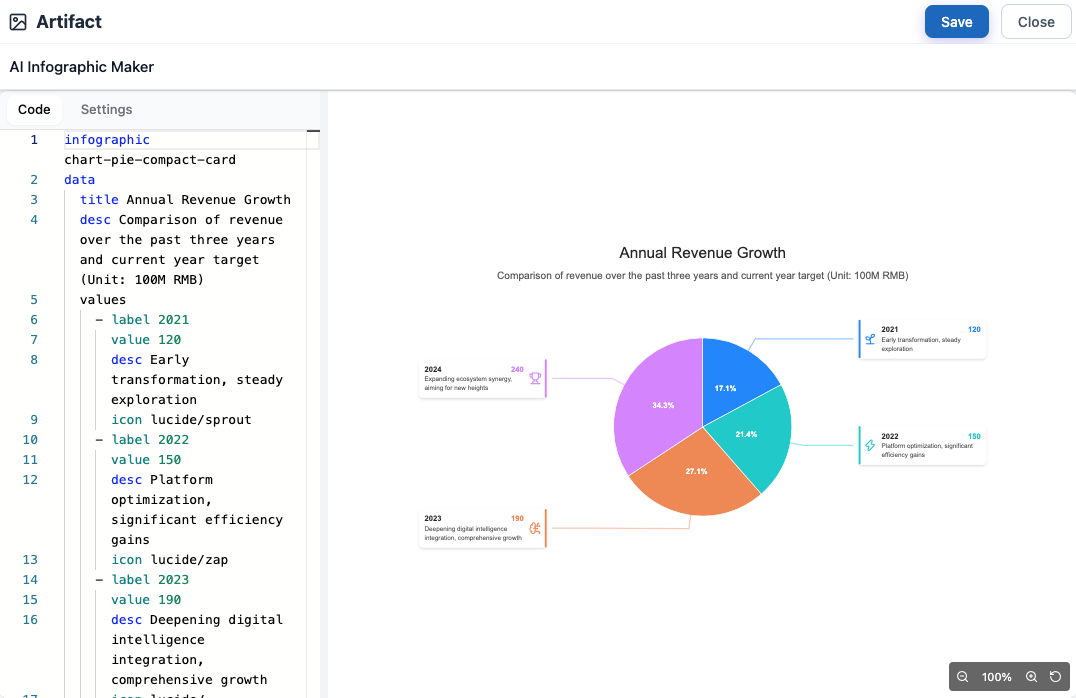
- Click Save and then Close to embed the dynamic graphic directly into your NotesKeep page.
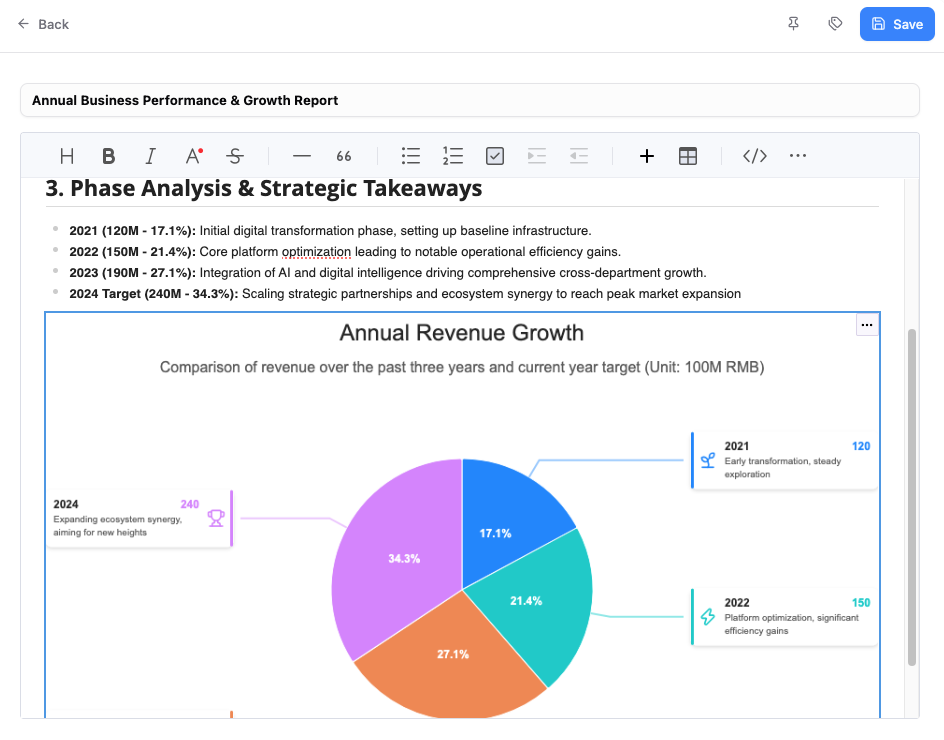
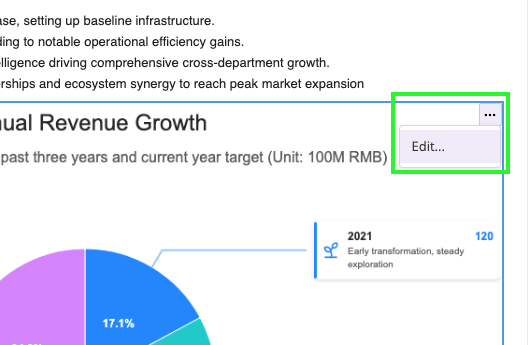
- To edit the data again, hover over the menu and click Edit.
Elevate Your Team’s Documentation Workflow
NotesKeep unites collaborative documentation, smart project insights, and team wikis into a cohesive platform. Integrating the Visual Paradigm Infographic Maker gives your team a faster way to turn abstract ideas into concrete visual assets without leaving your documentation flow.
Whether you are searching for an advanced knowledge management tool to organize team assets or a robust online diagram generator to enhance technical guides, this new capability provides a streamlined path from raw text to polished visual communication.