
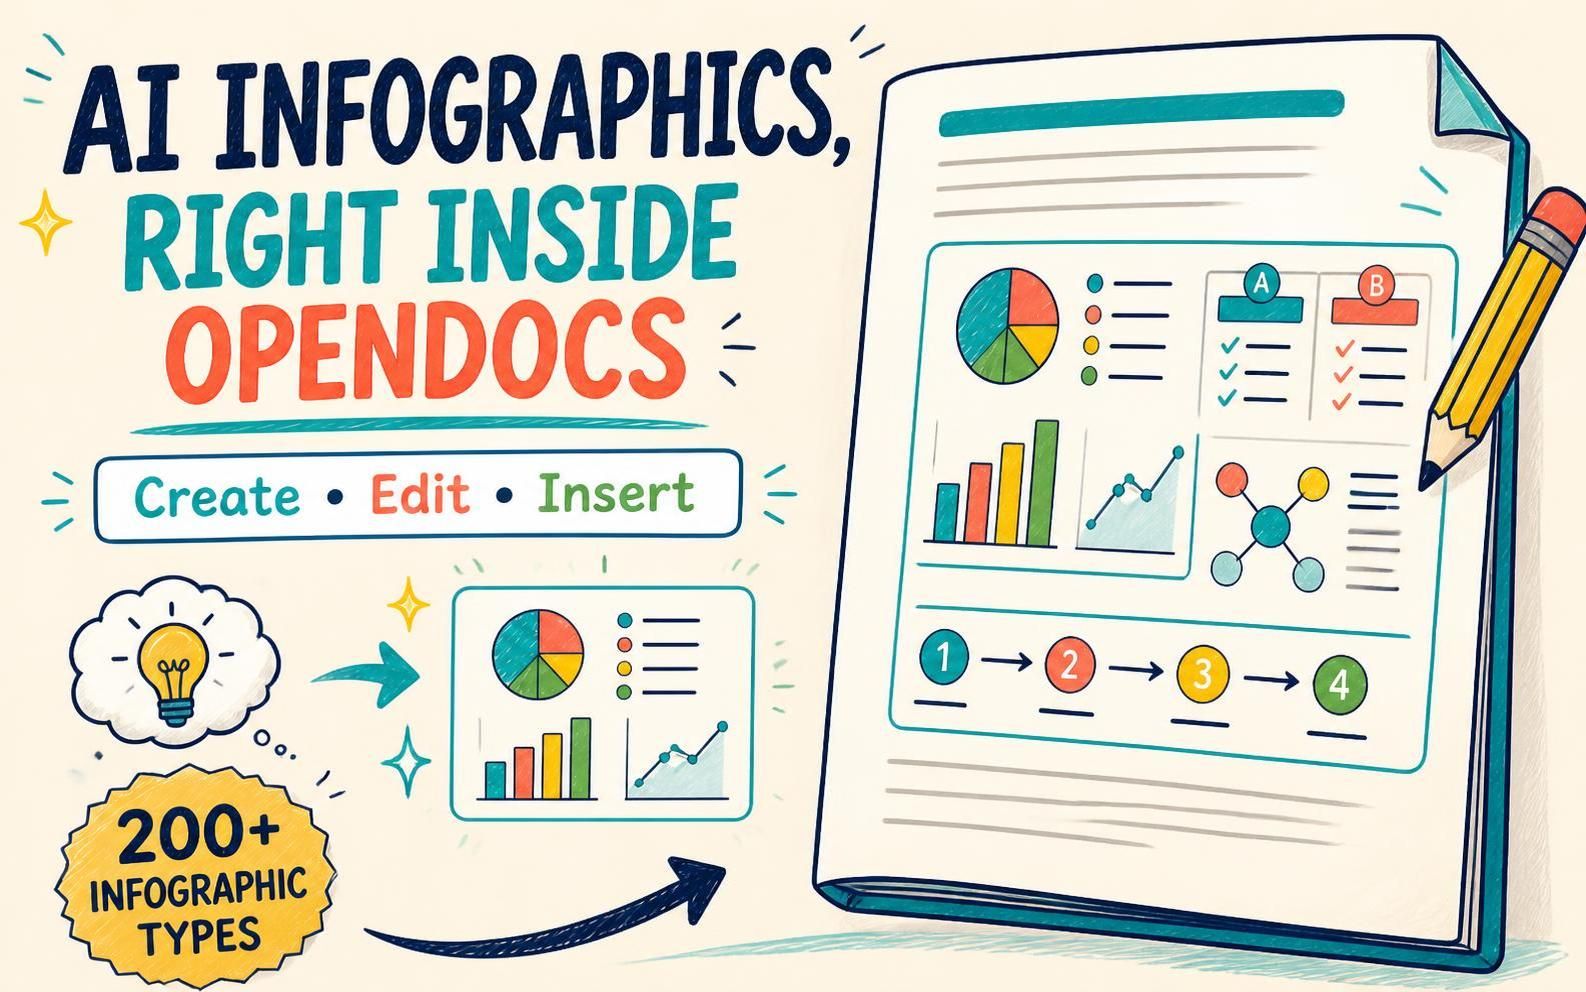
Good documentation does more than store information: it helps people understand it. Visual Paradigm OpenDocs now lets you create and insert editable infographics directly into a document page, bringing explanations, comparisons, processes, and key ideas together with your written content.
Through its integration with Visual Paradigm Infographic Maker, OpenDocs gives you access to more than 200 infographic types, including charts, comparisons, hierarchies, lists, quadrants, relationship diagrams, and sequences. Start with a template and customize it yourself, or use AI to generate an infographic from a description of your subject.
Explore Visual Paradigm OpenDocs or open OpenDocs and try it now.
Make Documentation Easier to Understand
Some ideas are easier to explain visually. A written description can tell readers how steps connect, how options compare, or how a process is organized—but an infographic can make those relationships easier to grasp at a glance.
With this update, you can place an infographic right where it supports the surrounding text. Instead of sending readers to another tool or asking them to interpret a dense block of prose, you can present the explanation and its visual companion together on the same page. That can make project documentation, internal guides, knowledge bases, educational resources, and process explanations clearer to read and easier to follow.
For teams using OpenDocs as a knowledge management tool, the integration helps bring more context into each page. Written information and editable visuals can live together in one document, making it easier to create and share knowledge-rich content.
From a Blank Page to a Useful Visual
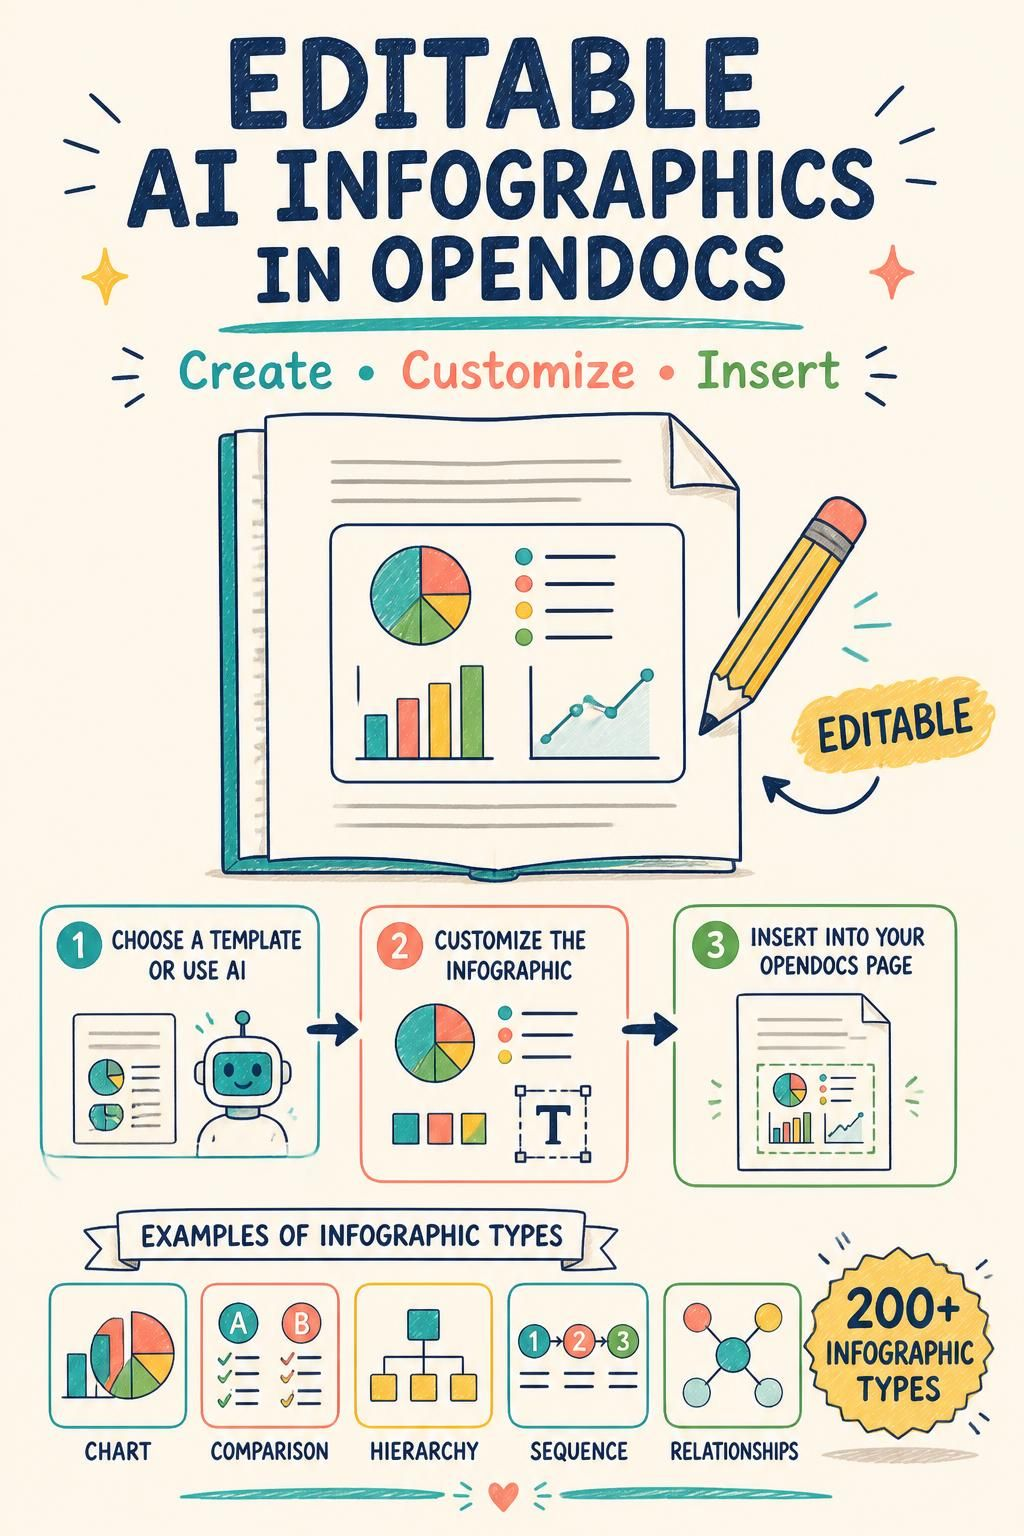
Creating an infographic does not have to mean starting from scratch. Choose from more than 200 infographic types to find a format that fits your content. Use a comparison layout to explain alternatives, a hierarchy to show levels or relationships, a sequence to lay out steps, or a chart to present information visually.
If you want a faster starting point, use the AI-powered infographic generation option. Describe the subject you want to illustrate, and AI will help generate a visual you can continue editing. It is a practical way to turn an initial idea into a draft infographic, then refine the wording, icons, and layout to suit your document.
Whether you prefer hands-on design or AI-assisted creation, the infographic remains editable. You can work with its code in the editor or make changes directly in the visual interface—for example, editing text or choosing a different icon.
Why Add Infographics Inside OpenDocs?
- Keep the explanation and visual together. Insert an infographic within the page, at the point where it helps readers understand the content.
- Explain complex information visually. Use formats suited to relationships, comparisons, sequences, hierarchies, lists, and charts.
- Get a head start with AI. Generate an initial infographic from a description of your subject, then tailor it to your needs.
- Maintain control over the result. Edit the infographic after generation or template selection, including its text and visual elements.
- Keep documentation connected to the work. Create the infographic from within the OpenDocs page workflow and insert it at your cursor position.
This addition strengthens OpenDocs as a knowledge management tool for creating documents that combine written explanations with visual communication. It also extends the Visual Paradigm ecosystem: OpenDocs provides a place to create, organize, publish, and share documents, while Infographic Maker supplies additional ways to turn ideas into visuals.
How to Create and Insert an Infographic
- Open Visual Paradigm OpenDocs and create a page or open an existing one.
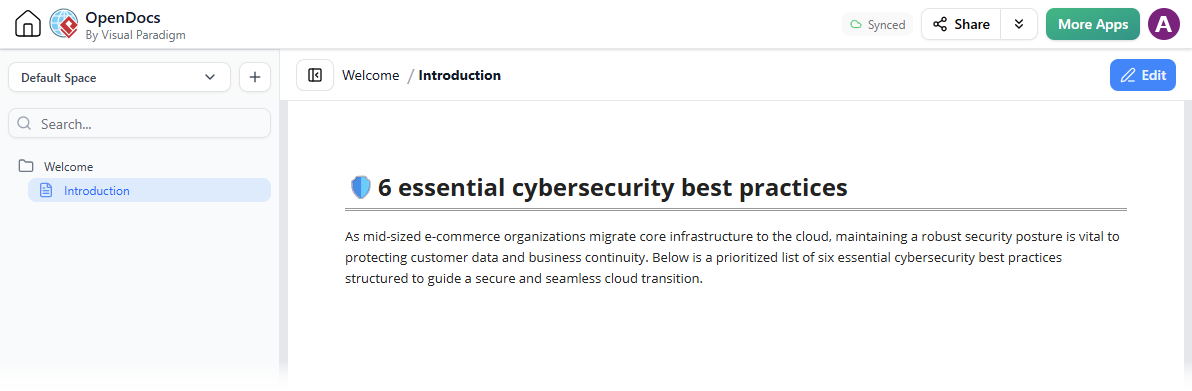
- Click Edit at the top-right corner of the page.

- Place your text cursor where you want the infographic to appear.

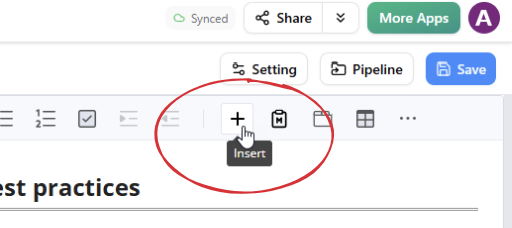
- Click the + button on the toolbar to open the “Create an Artifact” window.
- Select App on the left, then choose and open Infographic.
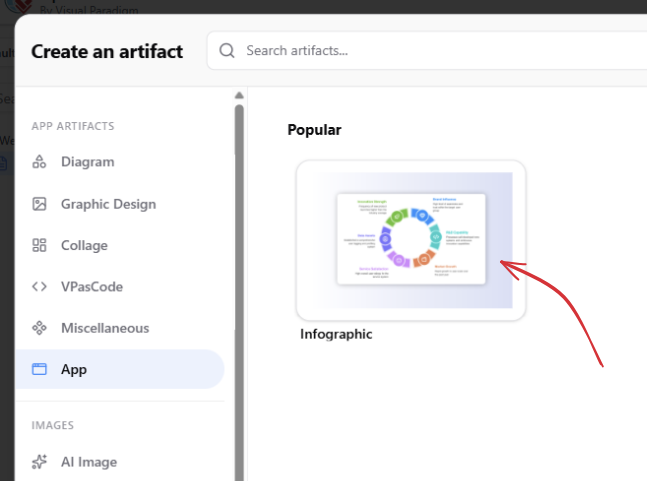
- Choose how you want to begin:
- Use a template: Point to the infographic type you want and click Use Template. Edit the infographic using its code or by interacting with the visual directly.
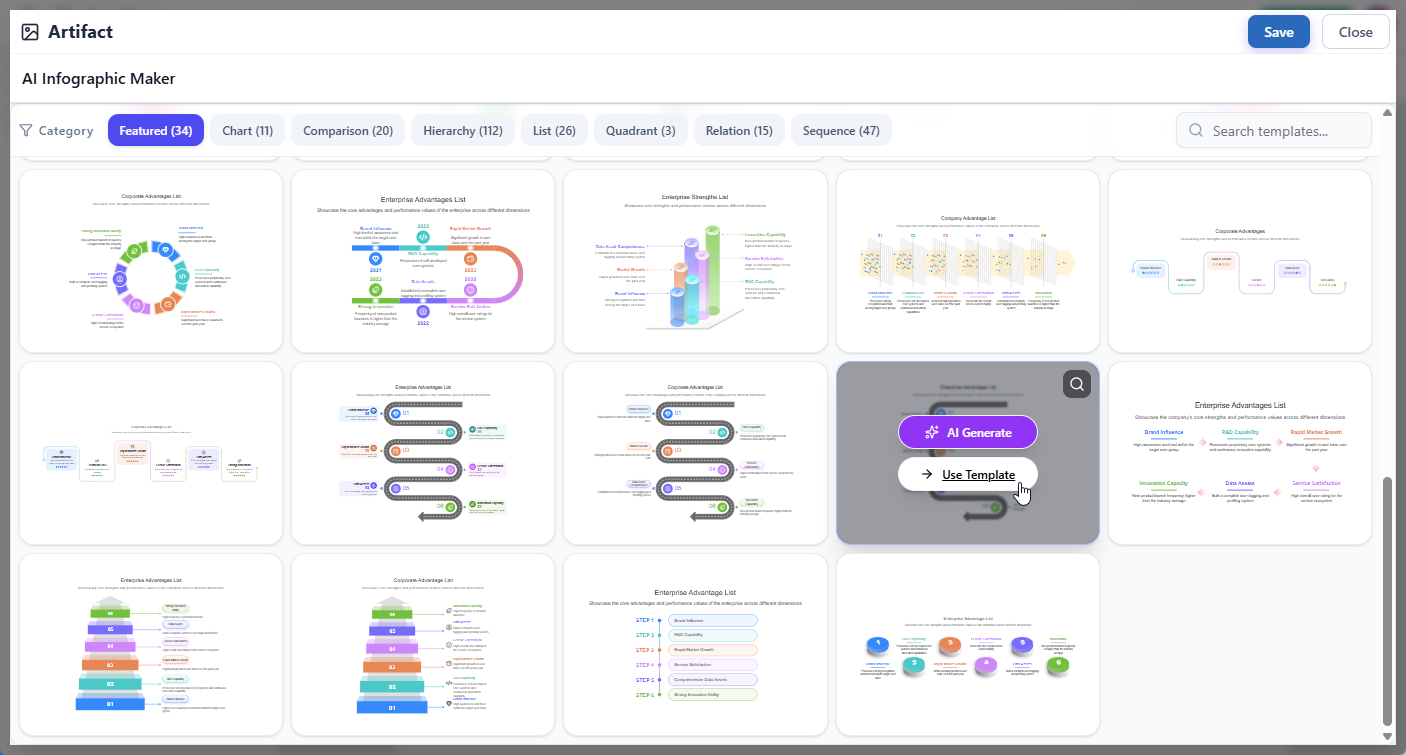
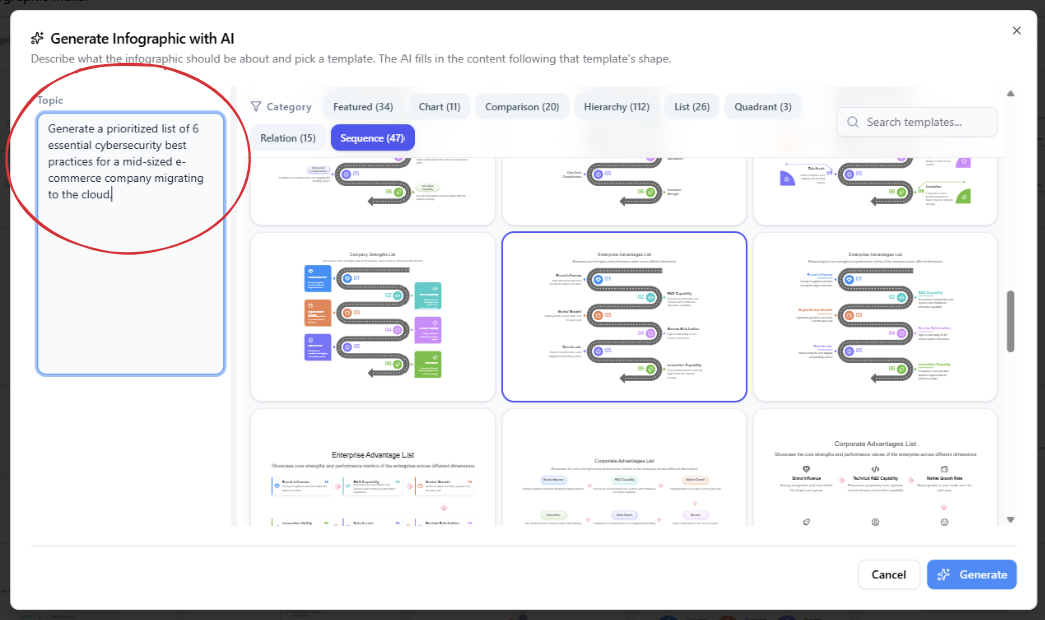
- Generate with AI: Point to an infographic type and click AI Generate. Describe the subject in the generation window and click Generate.
- Use a template: Point to the infographic type you want and click Use Template. Edit the infographic using its code or by interacting with the visual directly.
- Edit the text and style of your infographic.
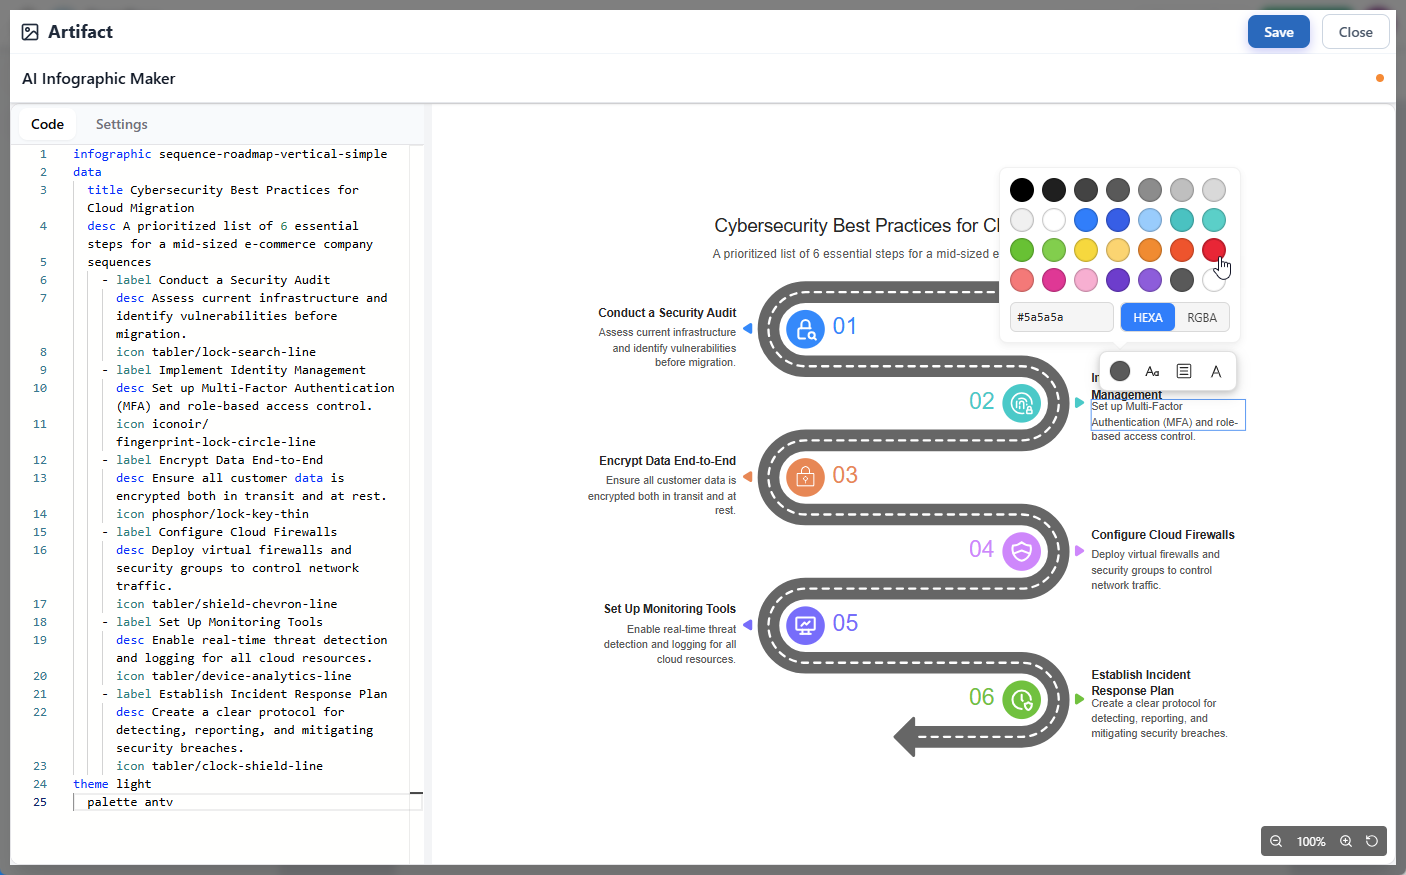
- When you are finished, click Save at the top right, then click Close to return to OpenDocs.
- The infographic is inserted into your page at the cursor position.

Edit an Infographic After Inserting It
Need to make a change later? Click the pencil icon at the top-right corner of the infographic on the page to reopen it in the editor.

Make your changes in Infographic Maker, then click Save and Close to refresh the infographic in OpenDocs.
This makes an embedded infographic more than a static illustration: you can return to the editor and update it as your explanation develops or your documentation changes.
Use Cases for Visual Documentation
The right visual can make a page more useful for its readers. For example, you can use an infographic to:
- Show the stages in a workflow or process.
- Compare products, plans, options, or approaches.
- Present a hierarchy, team structure, or set of categories.
- Summarize related ideas or explain how concepts connect.
- Organize information into a list or quadrant.
- Make a report, guide, or knowledge base article more engaging and scannable.
These are starting points: with more than 200 infographic types available, you can choose a visual format that fits the information you need to communicate.
A More Visual Knowledge Management Tool
OpenDocs brings document creation and sharing into a broader Visual Paradigm product ecosystem. Adding Infographic Maker to the page workflow gives users another way to explain ideas without separating the visual from the document it supports.
If you are looking for a knowledge management tool that helps you organize and share information, or an online diagram generator for creating visuals to support your documentation, this update offers a new workflow to explore: create or generate an infographic, edit it, and insert it directly into an OpenDocs page.
Start creating in OpenDocs and add an editable infographic to your next page.