


Connecting daily tasks to high-level business goals is a constant challenge. Static roadmaps and dense spreadsheets often fail to show the direct link between effort and outcome, leaving teams misaligned. To solve this, we’re thrilled to launch the AI KPI Performance Diagram Builder, a powerful new AI KPI tool that transforms how you visualize and manage your strategic objectives.
This innovative AI project management tool moves beyond traditional planning by creating a dynamic, clear, and intelligent map of your entire strategy in seconds, ensuring every initiative is directly tied to a measurable result.
Addressing the Challenge of Disconnected Strategies
In many organizations, strategic plans are created and then filed away. Teams work diligently on projects, but the “why” behind their work can become obscured. It’s difficult to see how a specific marketing campaign or a new system rollout truly impacts the bottom line.
This disconnect leads to wasted resources, misaligned priorities, and an inability to pivot quickly when a strategy isn’t delivering. Answering simple questions like, “Is this project moving the needle on our key goals?” becomes a time-consuming analytical exercise rather than an immediate insight.
Introducing the AI KPI Performance Diagram Builder: From Concept to Clarity in Seconds
The AI KPI Performance Diagram Builder was designed to eliminate this ambiguity. It serves as a single source of truth that visually articulates the cause-and-effect relationships within your business strategy, from the ground-level actions to the highest-level objectives.
With this new tool, you can:
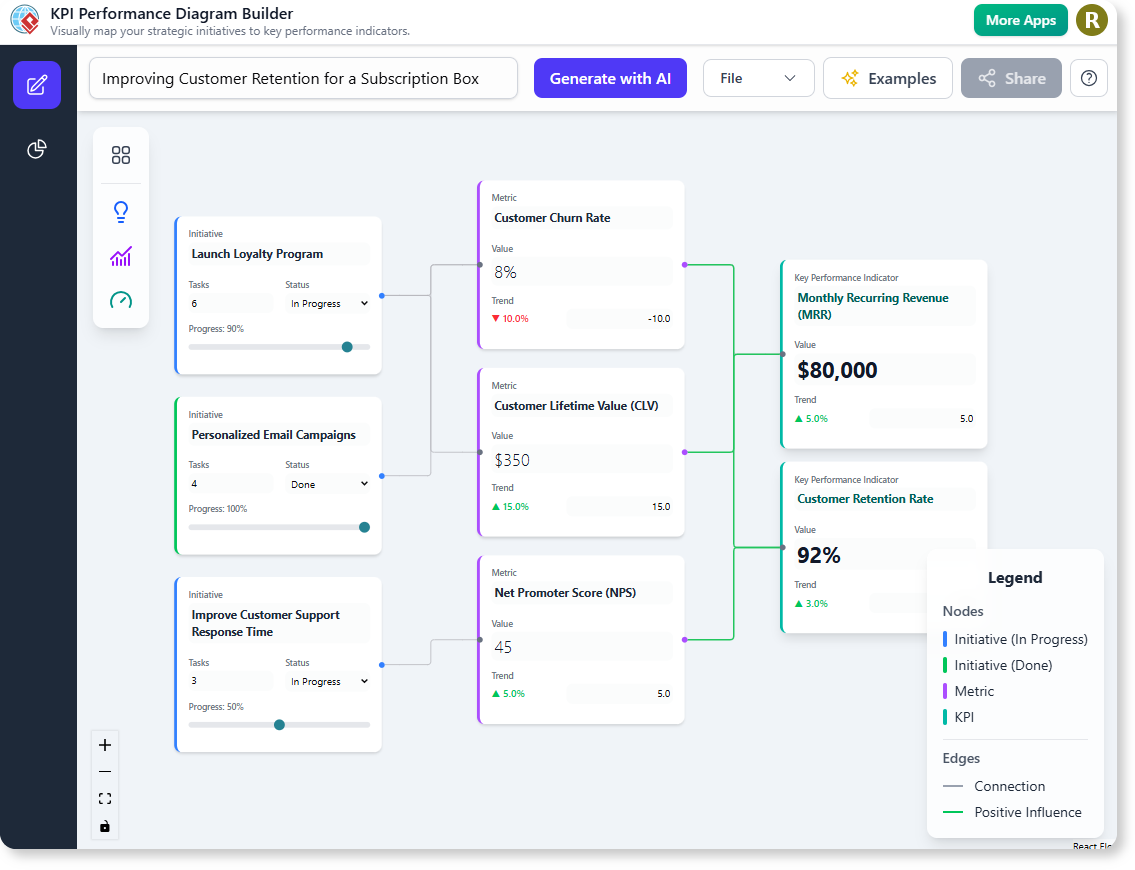
- Instantly Generate Diagrams: Simply describe your business domain, and our AI will generate a complete, logical diagram of relevant Initiatives, Metrics, and KPIs.

- Visualize Strategic Links: Clearly see how your projects (Initiatives) are designed to influence your operational measures (Metrics), and how those in turn drive your ultimate goals (KPIs).
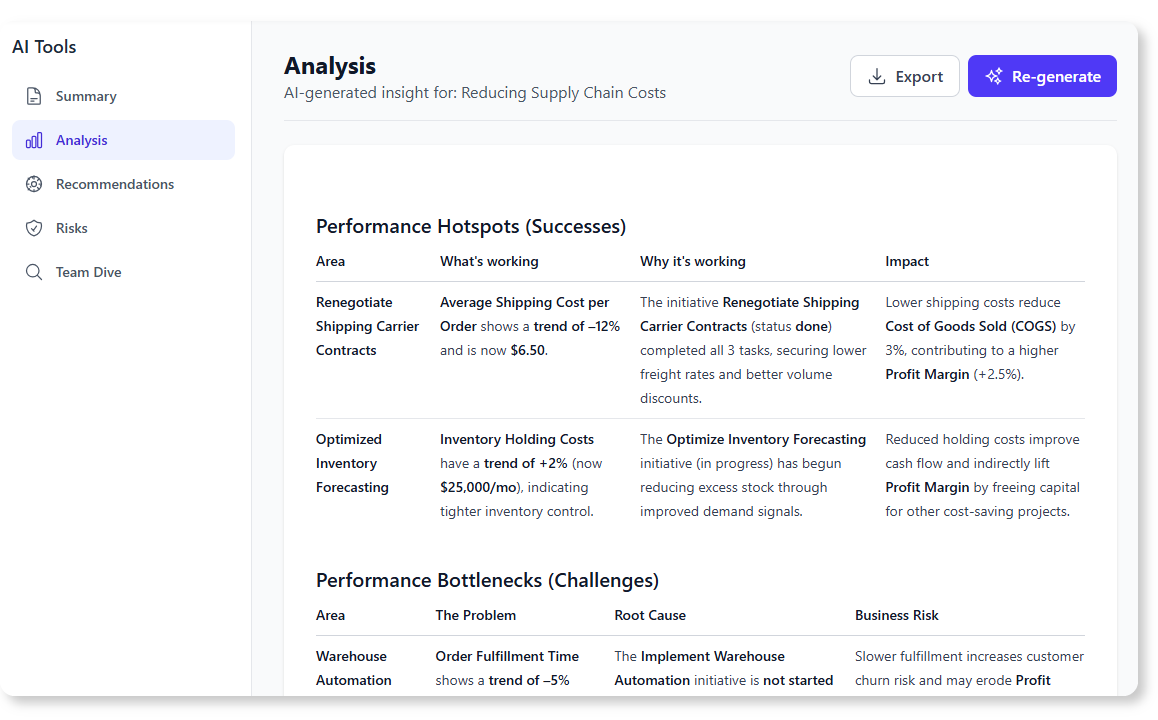
- Gain AI-Powered Insights: Go beyond visualization. The tool’s built-in AI can analyze your diagram to produce executive summaries, performance reports, and actionable strategic recommendations.
- Foster Team Alignment: Provide everyone, from project teams to C-level executives, with a shared, easy-to-understand view of the company’s strategic landscape.
How to Access and Use the New AI KPI Tool
Getting started is simple. The AI KPI Performance Diagram Builder is now available to all Visual Paradigm users with the appropriate subscription.
For Visual Paradigm Online Users (Combo Edition or higher):
- Simply navigate directly to the AI KPI Performance Diagram Builder in your browser.
For Visual Paradigm Desktop Users (Professional Edition or higher, with active maintenance):
- Open your Visual Paradigm desktop application.
- Go to the main menu and select Tools > App.
- Find and open the KPI Performance Diagram Builder from the list.
Once inside the app, just type your business or project domain into the input bar and let the AI handle the rest!
Ready to Supercharge Your Project Management?
Move beyond static plans and embrace a more dynamic, intelligent approach to strategic management. The AI KPI Performance Diagram Builder empowers you to not only set goals but to actively track, analyze, and optimize the path to achieving them.
Next Steps: