


Following the launch of the AI-Powered Value Stream Mapping Editor in Visual Paradigm 18.0, we’ve released the first update to address early user feedback and improve productivity. For the full original announcement, see: Introducing the AI-Powered Value Stream Mapping Editor.
Key enhancements include:
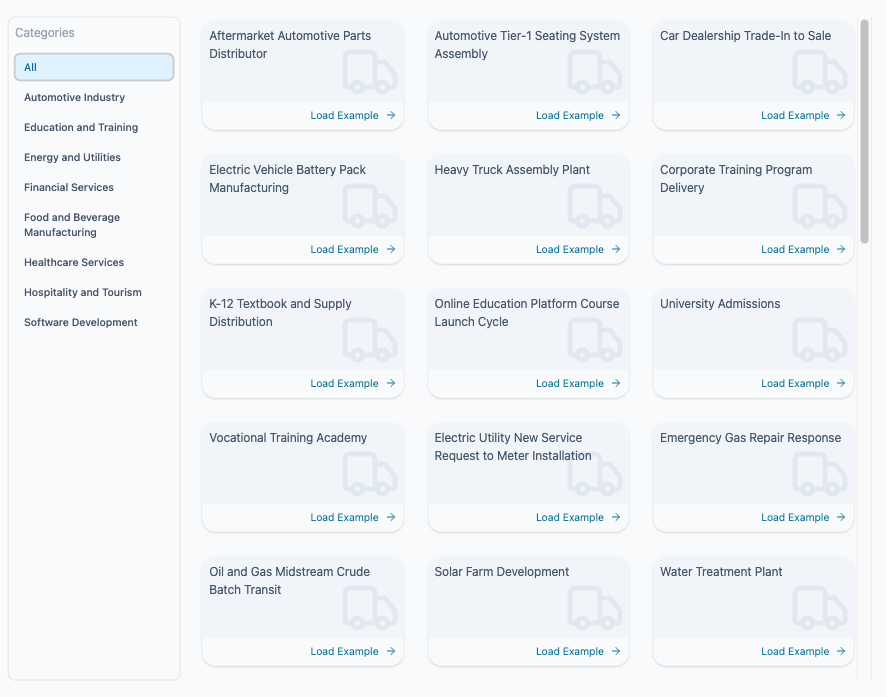
40 industry-specific starter examples
A new library provides 40 pre-built value stream maps spanning manufacturing, healthcare, software development, logistics, retail, construction, services, and more. Users can select an example matching their process or industry to instantly load a realistic starting map with typical processes, inventory stages, timelines, and metrics. From there, customize freely or refine with your own text description. This reduces setup time and helps users get mapping quickly.
UI refinements for improved usability
- The overall interface is now more compact, with optimized spacing, toolbar, and panel layouts. This allows more of the value stream map to be visible at once, reducing scrolling and improving general workflow efficiency.
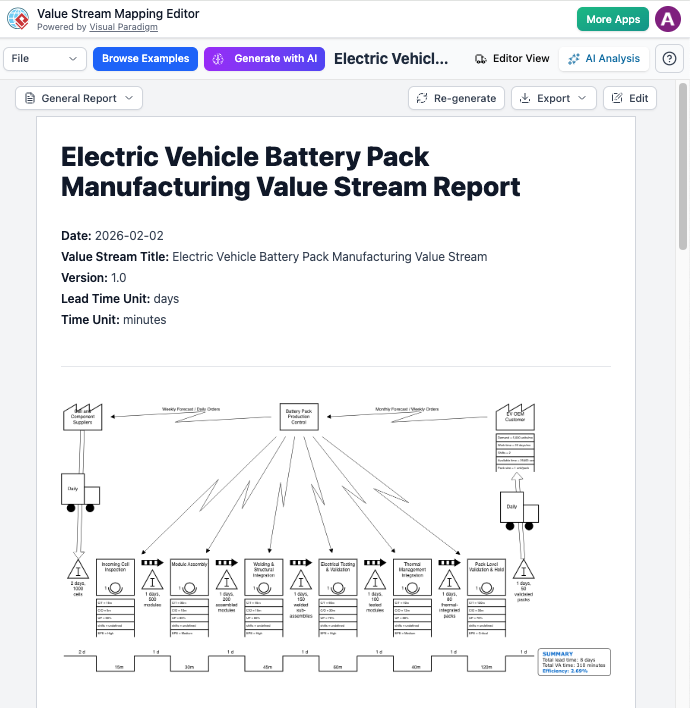
- The AI Analysis report page has been streamlined for better readability and management: tighter design, clearer typography, collapsible sections, and easier navigation between metrics, bottleneck identification, waste detection, and improvement recommendations.
These updates enhance the core capabilities you already use:
- Instant generation from plain English descriptions
- Interactive drag-and-drop editing
- Real-time Lean metrics calculation (lead time, value-added time, efficiency %)
- AI-driven insights and recommendations
- High-resolution PNG export
Start Mapping Smarter Today
Transform how you analyze and improve processes. With AI-powered generation, instant starter examples, real-time metrics, and actionable insights, eliminate manual drawing and uncover hidden inefficiencies faster. Streamline operations, reduce waste, and increase value delivery—right from your first map.