


Download Visual Paradigm Desktop
🕰️ Addressing the Challenge of Diverse Modeling Needs
In modern system analysis and project management, relying on a single diagram type is often insufficient. Analysts frequently need to switch between high-level conceptual maps (like Mind Maps), process-focused diagrams (like DFDs), and data models (like ERDs).
Before this update, creating these specialized models required users to manually select shapes, apply specific notations (such as Chen or Gane-Sarson), and spend significant time structuring the diagram correctly—a slow, error-prone process that diverted focus from core analysis.
🚀 Introducing New AI Diagram Types: Accelerate Analysis and Design
This expansion was built to address the increasing demand for instant, structured, and compliant visualizations across multiple domains. By leveraging AI for these new diagram types, Visual Paradigm helps maintain rigor and consistency while boosting productivity.
The updated AI Diagram Generator allows you to:
- Instantly Model Diverse Views: Generate key analysis tools like the Data Flow Diagram (DFD) using various notations (Gane-Sarson, Yourdon & Coad, Yourdon DeMarco) or detailed data structures using ERD (Chen Notation).
- Accelerate System Design: Quickly kick off complex engineering projects by generating a SysML Internal Block Diagram (IBD) from a textual description.
- Simplify Complex Decisions: Rapidly generate structured models such as Decision Tables and CRC Card Diagrams for logic and class analysis.
- Tailor to Any Audience: Use AI customization options—including tone, content type, and target audience—to ensure the resulting diagram and accompanying documentation fit your exact publication needs.
Comprehensive List of New Supported Diagram Types:
- Data Analysis: Data Flow Diagram (DFD), ERD (Chen Notation), Gane-Sarson DFD, Yourdon & Coad DFD, Yourdon DeMarco DFD
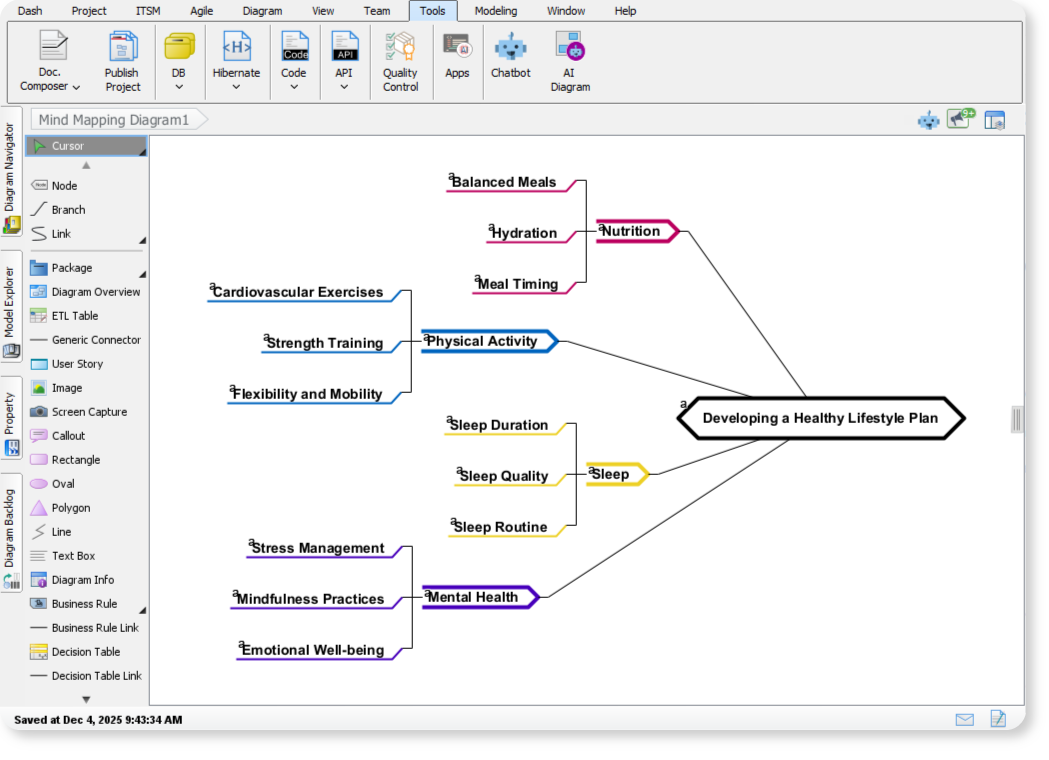
- Conceptual & Planning: Mind Mapping, Decision Table, Implementation Plan Diagram, Migration Roadmap
- System Engineering: SysML Internal Block Diagram
- Object-Oriented Design: CRC Card Diagram
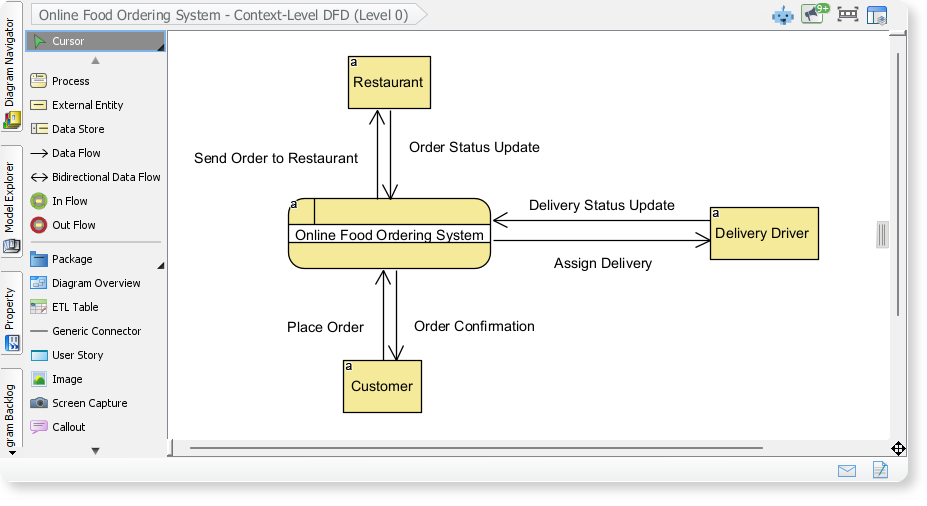
DFD Example: Online Food Ordering System
Here is a Data Flow Diagram (DFD) generated with Visual Paradigm AI Diagram Tool, showing how information moves through a process. In this example, you can see how orders, payments, and customer details flow between the customer, the ordering platform, and supporting systems.
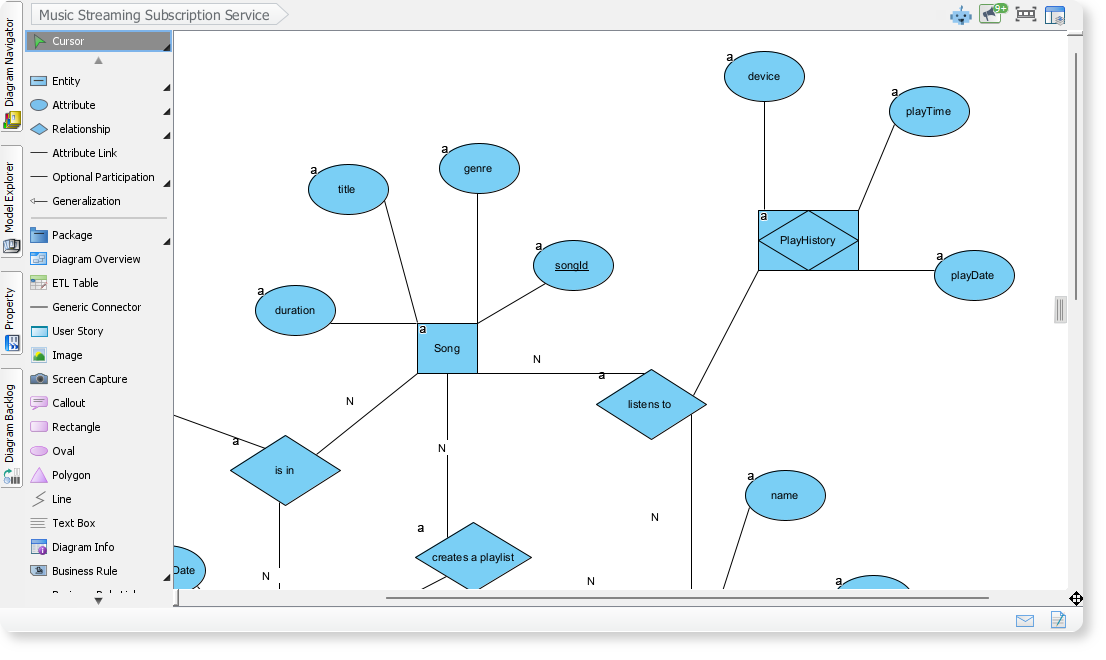
Chen Notation ERD Example: Music Streaming Subscription Services
By entering the system name “Music Streaming Subscription Services” , VP AI Diagram Tool generates a Chen Notation Entity-Relationship Diagram (ERD) illustrating data entities and the relationships between them. In this example, it maps the core elements of a music streaming subscription service, such as users, subscription plans, artists, and playlists. It helps explain how the platform’s data is structured and how different components are connected.
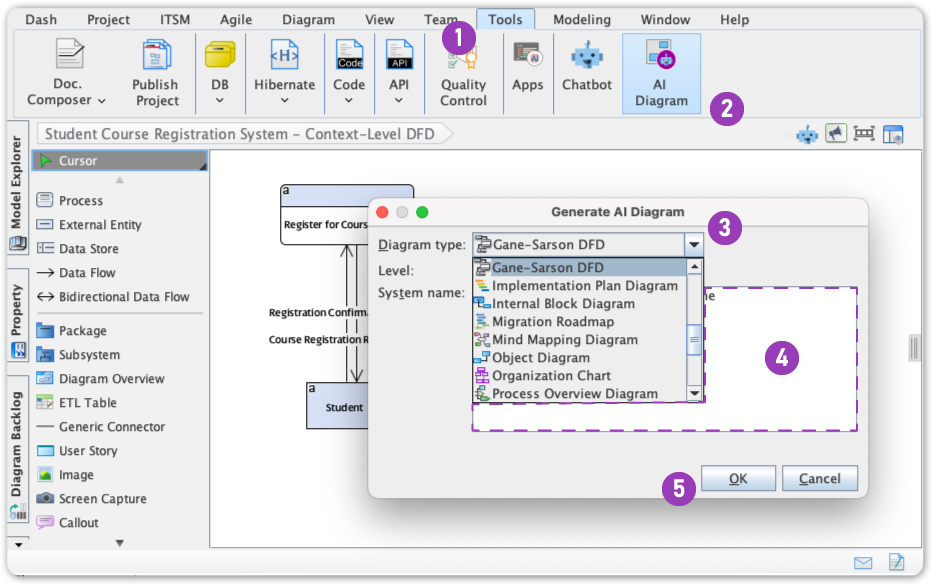
⚙️ How to Access and Use the New Feature
Generating any of these new diagram types is quick and intuitive, following the existing AI Diagram Generator workflow:
- Click on Tool.
- Select AI Diagram
- Select a specific Diagram Type from the dropdown menu
- Enter a topic
- Hit OK
🎯 Ready to Transform Your Modeling Workflow?