


Managing project timelines often involves complex tools or manual coding, making it difficult to visualize progress and adapt to changes quickly. We’re excited to solve this challenge with the launch of the Gantt Chart Builder, a powerful and intuitive free gantt chart builder designed to bring your project plans to life instantly.
This new online tool empowers both project managers and developers to create, customize, and render beautiful Gantt charts with an easy-to-use interface and see the results in real-time.
Addressing the Challenge of Complex Chart Configuration
Previously, creating a detailed Gantt chart required deep technical knowledge or reliance on rigid software. Developers had to write and tweak configuration code line by line, while project managers struggled with tools that lacked flexibility and real-time visual feedback. This disconnect made quick updates and collaborative planning a frustrating, time-consuming process.
Introducing the Gantt Chart Builder: Your Visual Project Timeline Editor
The Gantt Chart Builder was built to bridge the gap between powerful customization and user-friendly design. It provides a seamless experience where visual edits in the UI are instantly translated into clean, ready-to-use code, and vice-versa. This real-time synchronization ensures what you see is exactly what you get.
With our new Gantt chart editor, you can now:
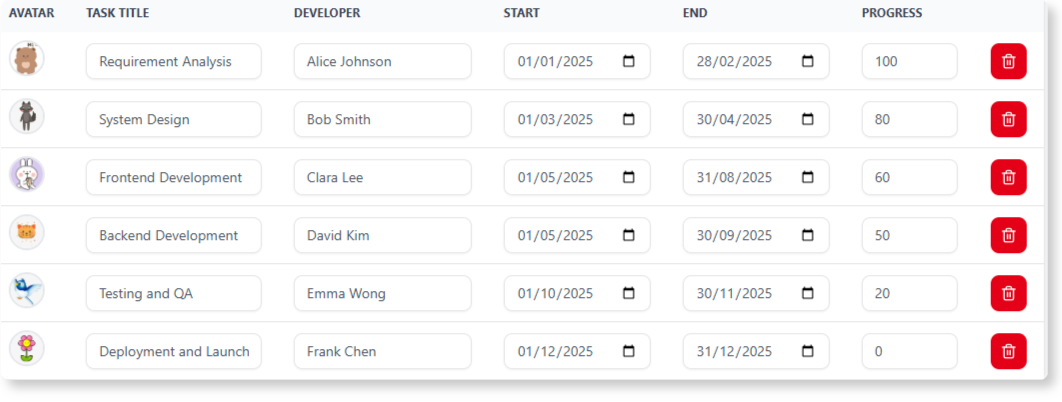
- Build Timelines Visually: Add, edit, and delete tasks using a simple table editor without touching a single line of code.
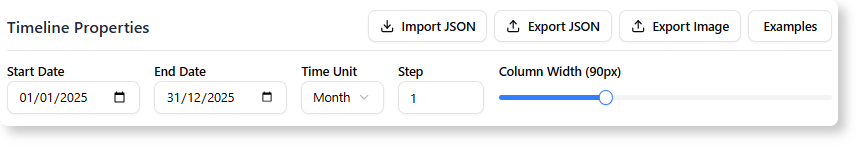
- Customize in Real-Time: Adjust timeline properties like start/end dates, time units, and column widths, and watch your chart update instantly.
- Generate Code on the Fly: The builder automatically generates the complete chart configuration code, perfect for developers to integrate into their own projects.
- Personalize Your Charts: Easily assign custom avatars to team members for a more personalized and readable project overview.
How to Access and Use the New Feature
Getting started with the Gantt Chart Builder is simple. Here’s how you can access it:
- For Visual Paradigm Online Users: Simply navigate directly to the Gantt Chart Builder to start immediately.
- For Visual Paradigm Desktop Users: Open your desktop application, go to the main menu, select Tools > App, and choose the Gantt Chart Builder from the list.
Once you’re in the app, follow these simple steps:
- Use the Task Data editor to add new tasks or modify existing ones (e.g., title, developer, dates).
- Fine-tune your timeline’s appearance using the Timeline Properties controls.
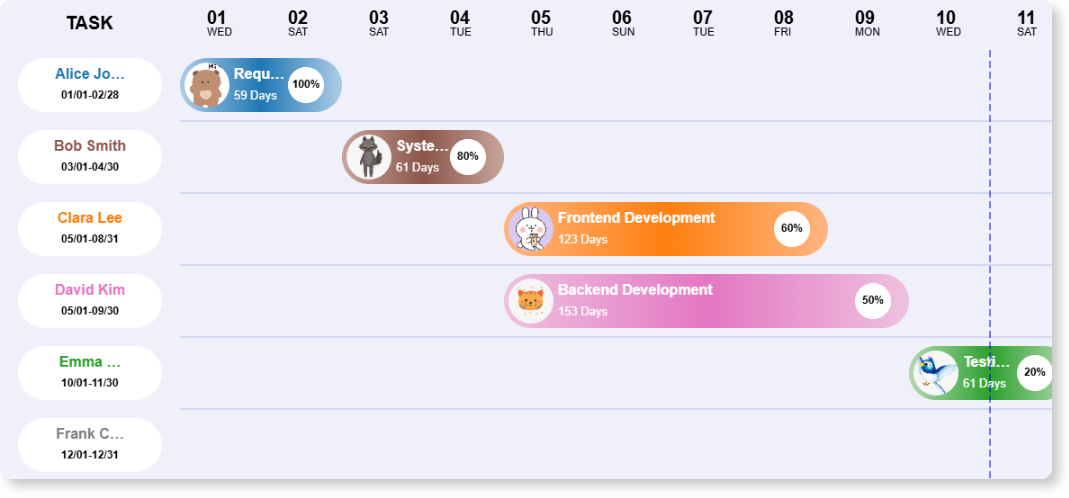
- Click the Render Chart button to instantly see your changes in the Live Preview panel.
- Once satisfied, copy the generated configuration from the code editor for your own use.
Ready to Streamline Your Project Planning?
The Gantt Chart Builder is more than just a tool; it’s a new way to collaborate on and visualize project timelines. It’s designed to save you time, reduce complexity, and provide a clear, beautiful overview of your projects. This feature is available now and is completely free for all Visual Paradigm users.
Learn More: For detailed information and examples, check out our official documentation.
Explore the Gantt Chart Builder Guide
Primary Call to Action: Ready to build your first chart? Jump right in and see how easy it is.