


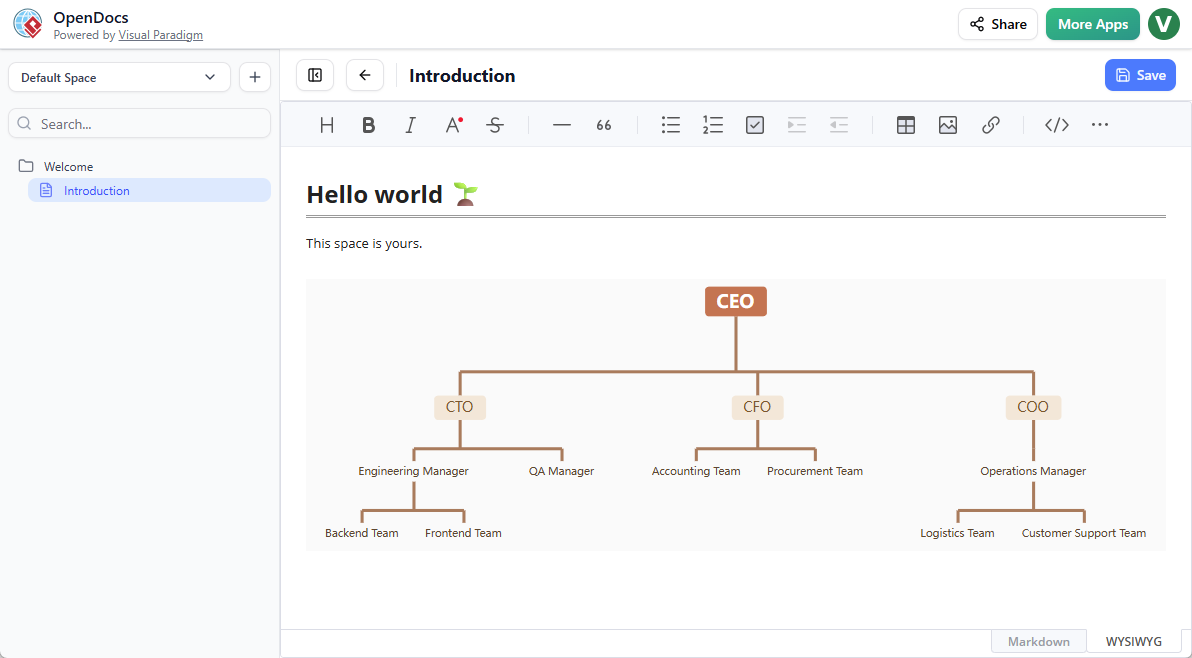
Visual Paradigm is excited to announce the latest expansion to OpenDocs, our comprehensive AI-powered knowledge management tool. We have officially added Organization Charts to our suite of supported diagrams, giving you a professional way to visualize company hierarchies and reporting structures directly within your documentation.
As teams grow and projects become more complex, maintaining a clear picture of “who is who” is vital. OpenDocs now provides the specialized tools you need to build clear, professional Org Charts that integrate seamlessly with your project manuals, onboarding guides, and internal wikis.
Clearer Hierarchies, Better Documentation
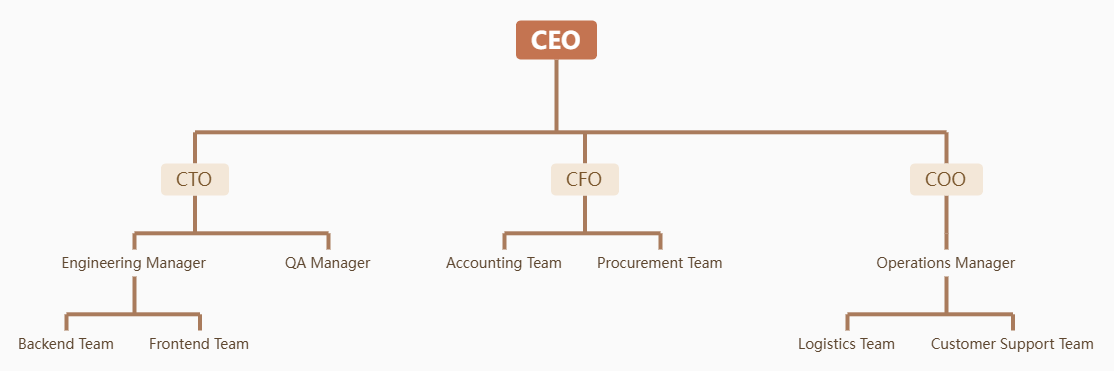
The new Organization Chart tool in OpenDocs is designed for precision and ease of use. Whether you are mapping out a small startup or a multi-department enterprise, our editor allows you to construct detailed diagrams that reflect your unique structure.
By adding Org Charts to your workspace, you can:
- Clarify Reporting Lines: Eliminate confusion by providing a visual reference for team leadership and departmental boundaries.
- Improve Onboarding: Help new team members navigate the organization from day one by embedding charts directly into welcome documents.
- Centralize Team Data: Keep your structural diagrams in the same AI-powered knowledge management tool where you store your technical specs and meeting notes.
Seamless Integration with OpenDocs Workflows
One of the greatest strengths of OpenDocs is its flexibility. You don’t just create a diagram; you make it part of your living documentation. You can utilize Organization Charts in two distinct ways:
- Embed in Markdown: Use the “Insert Diagram” feature to place an Organization Chart directly inside a document page, surrounding it with the text context your team needs.
- Dedicated Component Pages: Create a full-page diagram for a high-level view of your entire organization, making it easy to share as a standalone resource.
Discover the full capabilities of the platform on our OpenDocs Landing Page.
Why Build Your Org Charts in OpenDocs?
While OpenDocs is known as a leading AI-powered knowledge management tool for its text and image generation, its manual diagramming capabilities remain world-class. Our Organization Chart tool offers:
- Professional Styling: Create high-quality, presentation-ready charts that look great in any internal or public-facing document.
- Easy Updates: As your team changes, simply click the embedded diagram to edit it “on the fly” without leaving your document page.
- One-Click Sharing: Publish your entire Space—including your Org Charts—to a shareable URL for instant stakeholder feedback.
How to Create a Organization Chart?
As part of a document page
- Open your page in OpenDocs.
- Click on the Edit button at the top right.
- In the page editor, click at where you want to insert a organization chart.
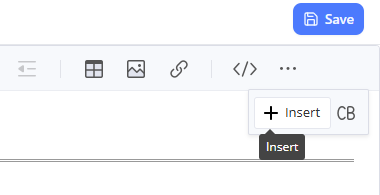
- Click on the Insert button at the button bar.
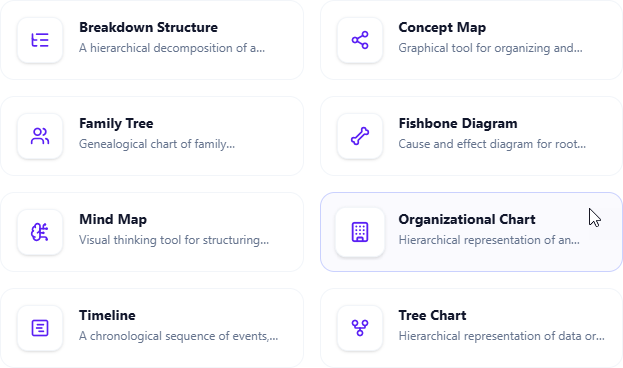
- Select Mind Maps > Organization Chart.
- Start editing your organization chart.
- When finished, click Save at the top right.
- Click Close to return to the document page editor.
As an independent component
- On the top of the table of contents pane, click on + and then select New Component Page.
- Select Mind Maps > Organization Chart.
- Start editing your organization chart.
- When finished, click Save at the top right.
Expanding Your Visual Toolkit
The addition of Organization Charts is part of our commitment to making OpenDocs the most versatile documentation hub on the market. Alongside other new additions like Mind Maps, Timelines, and Family Trees, we are ensuring that every piece of knowledge your team possesses has a professional home.
Ready to map out your organization?
Access the Organization Chart tool inside OpenDocs today and start building a more transparent workspace.
For a deep dive into all our documentation features, visit the official OpenDocs page.