


Turning complex strategic analyses into clear, compelling visuals can be a time-consuming challenge. We’re thrilled to introduce a powerful solution: the 5-Aspects Infographic Designer. This innovative AI 5-aspect infographic generator empowers you to instantly transform raw analytical data into polished, presentation-ready infographics, saving you hours of manual design work.
Addressing the Challenge of Manual Infographic Design
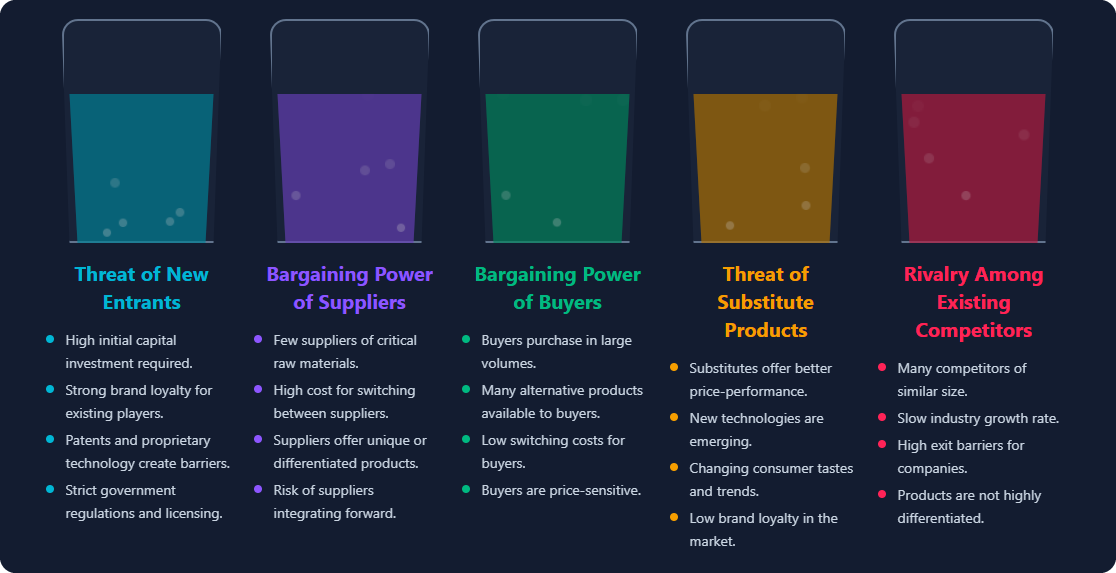
Previously, creating a visual representation of frameworks like Porter’s Five Forces or a SMART Goal analysis involved a multi-step, often tedious process. You had to conduct your research, structure the data, and then spend valuable time in a separate design tool, painstakingly arranging shapes, text, and colors to build a professional-looking chart.
This disconnect between analysis and presentation not only slows down your workflow but can also lead to inconsistent and less impactful visuals. We knew there had to be a better way.
Introducing the 5-Aspects Infographic Designer: From Text to Visuals in Seconds
Our new AI tool was built to bridge the gap between strategic thinking and powerful visual communication. By integrating a powerful AI engine with a versatile design interface, we’ve streamlined the entire process, allowing you to focus on your insights, not on the design tool.
With the 5-Aspects Infographic Designer, you can:
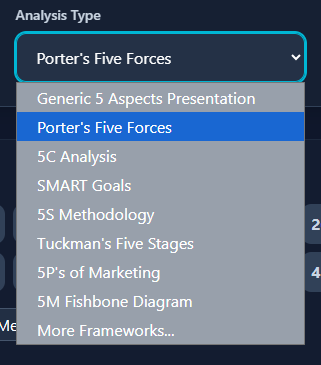
- Instantly Generate Analyses: Simply enter a topic and choose from dozens of strategic frameworks—from SWOT and PESTLE to Mintzberg’s 5 Ps—and let the AI generate a complete, structured analysis for you.
- Explore Diverse Visual Layouts: Say goodbye to cookie-cutter charts. With over 50 distinct layouts, you can visualize your data as a timeline, mind map, comic strip, 3D carousel, and much more.
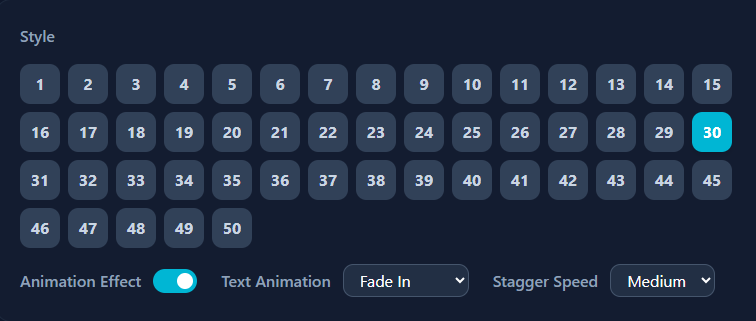
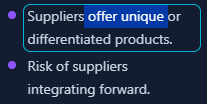
- Customize with Ease: Every element of your infographic is editable. Tweak the generated text, adjust the layout, and fine-tune the design in real-time to perfectly match your needs.
- Export for Any Platform: Download your finished infographic as a high-quality PNG for seamless integration into reports and presentations, or export it as an interactive HTML file for web use.

How to Access and Use the New Feature
Getting started with your first AI-powered infographic is simple. Here’s how to access the tool:
- For Visual Paradigm Online users: Simply navigate to the 5-Aspects Infographic Designer app.
- For Visual Paradigm (Desktop) users: Select Tools > App from the application menu, then click on the “5-Aspects Infographic Designer” from the list.
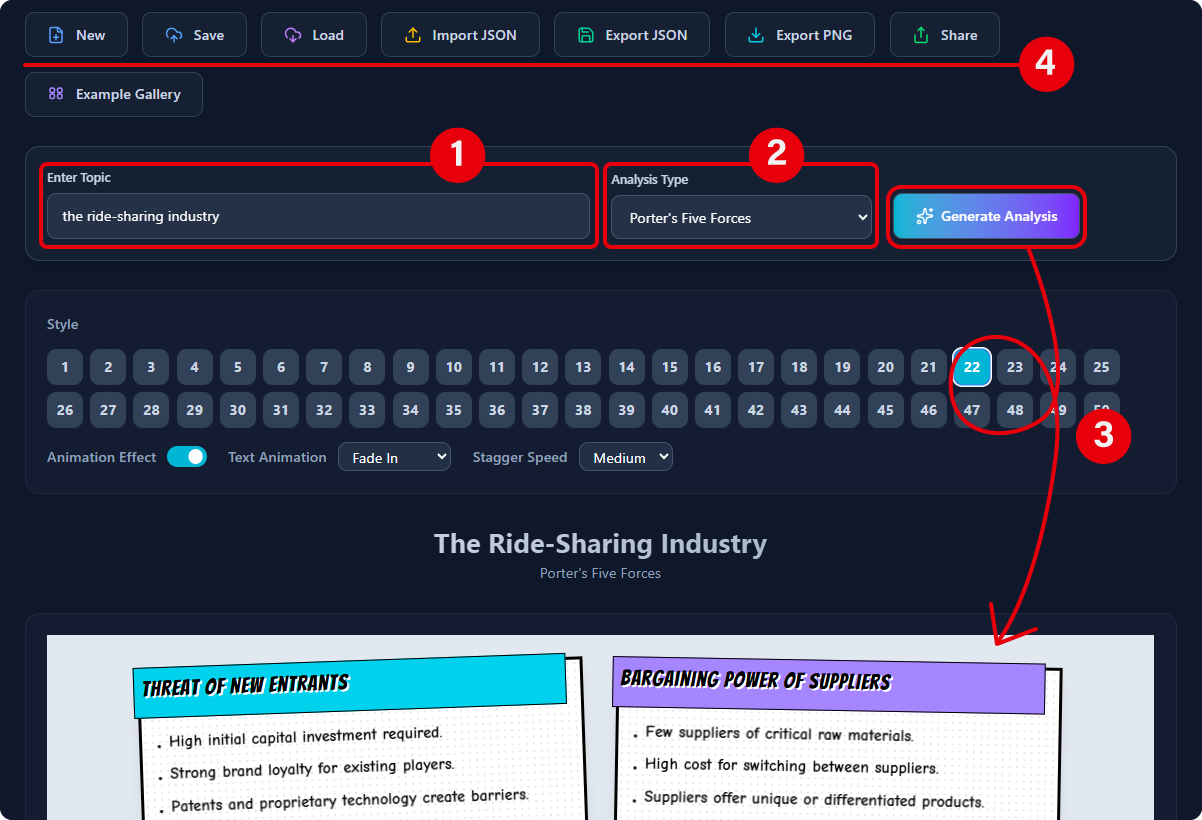
Once you’re in the app, the process takes just a few clicks:
- Enter Your Topic: Type the subject of your analysis into the input field.
- Select Your Framework: Choose a strategic model from the comprehensive dropdown list.
- Generate & Customize: Click “Generate Analysis” and watch the AI build your infographic. You can then edit the data and cycle through layouts to find the perfect style.
- Export: Save your work as a project file or export it as a PNG or HTML file.
This feature is available to Visual Paradigm Online users with a Combo Edition (or higher) subscription and Visual Paradigm (Desktop) users with a Professional Edition (or higher) license and active maintenance.
Ready to Supercharge Your Strategic Presentations?
The 5-Aspects Infographic Designer is more than just a tool; it’s your new partner in strategic communication. Stop wasting time on manual design and start creating clear, impactful, and visually stunning analyses in a fraction of the time. Elevate your reports, presentations, and strategic documents today.